Skip to content

Early access · Trace Analyzer is live

Backend diagnostics for teams running microservices

Paste a distributed trace and BackendBytes Diagnostics finds the critical path, the N+1 calls, the serial reads, and the errors your caller never saw — then ranks what to fix first.

Free · runs in your browser · no account · nothing uploaded · See the platform

5 free tools63 cited engineering articles

Trace Analyzer
synthetic sample · 20 spans · 8 services · 1.26 s
  1. Highup to 308 ms recoverable

    12× the same call under “checkout.PlaceOrder”

  2. Mediumup to 382 ms recoverable

    card-network · POST /v1/authorize owns 30% of the critical path

Run it on your own trace →

What it does, and what is still being built

Every line carries its status. Nothing marked live is a demo.

  • Inspect traces and telemetry

    Turn an exported trace into a ranked list of what is making the request slow or wrong.

    • LiveOTLP/JSON and Jaeger trace import, entirely in the browser
    • LiveCritical path, self time, and per-service breakdown
    • LiveErrors that never reached the caller (swallowed failures)
    • PlannedCorrelating a trace with the metrics and logs around it
  • Analyze service architecture

    See the architecture a request actually exercised, not the one on the diagram.

    • LiveService-to-service call table derived from one trace
    • In developmentAggregating many traces into a dependency map with per-edge latency and error rate
    • PlannedFlagging chatty or deeply nested call chains across a sample of traces
  • Debug and optimize

    Every finding says what to try next. Explanations tied to your own code and stack are being built.

    • LivePer-finding recommendations: batch, parallelize, cache, instrument
    • In developmentClaude-assisted explanations that tie a finding to your stack and a candidate fix
    • PlannedCI check that compares exported traces between builds to catch latency regressions

How it works and what is next →

Engineering Blog

From the engineering blog

The reasoning behind the tools: distributed systems, database internals, and AI infrastructure. 63 articles, every claim cited to a primary source.

Curated

Start with the lead story, or pick from the reads that show what the rest of the library looks like.

Browse all articles
Designing a Multi-Agent Backend: The Orchestrator Pattern
Hard
AI Engineering
#ai#llm

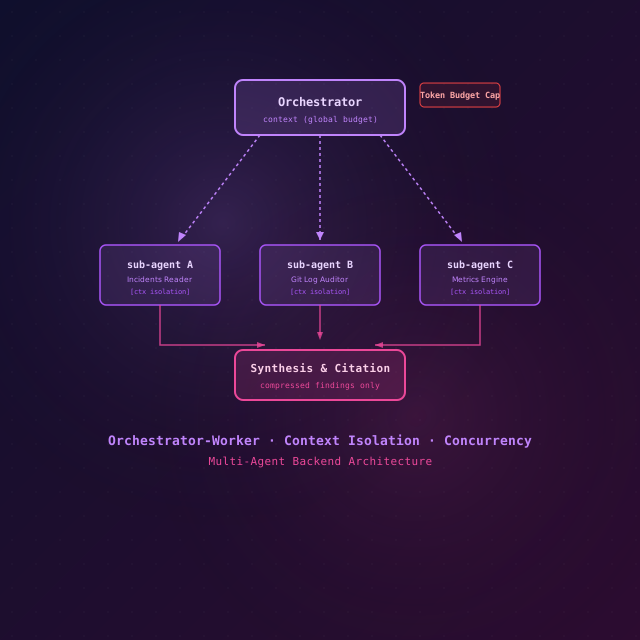
Designing a Multi-Agent Backend: The Orchestrator Pattern

Picture one agent, one context window, one serial loop — until it hits 180K tokens and silently drops 37 of the 40 services it was asked to audit. The orchestrator pattern fans work out to isolated sub-agents in parallel, then synthesizes. Here's the backend, in compiling Go.

BackendBytes Engineering Team
24 min readRead
JVM Cold Start in 2026: Leyden vs GraalVM Native Image vs CRaC
Hard
Backend Engineering
#java#jvm

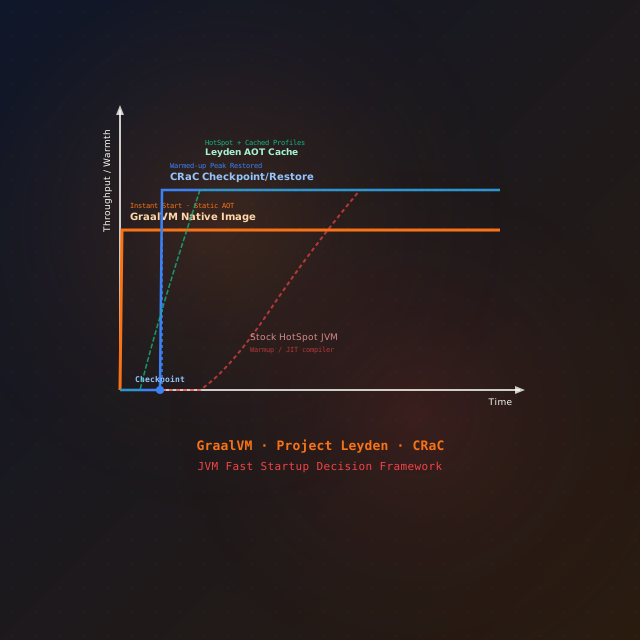
JVM Cold Start in 2026: Leyden vs GraalVM Native Image vs CRaC

Slow JVM cold start breaks scale-to-zero and autoscaling. Three ways to fix it in 2026 — Project Leyden's AOT cache, GraalVM Native Image, and CRaC — with the exact commands, the trade-offs, and a decision framework.

BackendBytes Engineering Team
24 min readRead