Go vs Java in 2026: An Honest Performance Comparison for Backend Services

Lesson 6 of 6
"Should we rewrite it in Go?"
Picture a payment-style service whose p99 jumps from, say, ~40ms to ~400ms during JVM GC pauses, and a backend team split down the middle: half want Go for the consistent latency floor, half want to stay on the JVM and switch to ZGC[1] to fix the pauses without a rewrite. This article is built to settle that argument honestly: with what each runtime actually documents, a decision framework, and a benchmark harness you can paste into a repo — so the deciding numbers are yours, not a blog's.
On raw throughput there is no consistent winner — in TechEmpower Round 23 the lead between Gin and Spring (servlet) flips by test type[2], and virtual threads[3] removed Java's old concurrency-model handicap. What differs: Java with ZGC[1] is documented to hold GC pauses under a millisecond (removing GC pauses as a source of p99 spikes), the JVM's committed-heap model gives it a structurally higher memory floor than a typical Go process, and the Java ecosystem (Spring Data, Hibernate) is genuinely better for complex domain models. Pick by workload shape, not by single-number comparisons.
- Go wins: low memory floor, instant startup, simpler concurrency model, container density
- Java wins: ORM maturity, enterprise ecosystem, JIT peak throughput after warmup
- Cost: density-driven — compute it from your own measured RSS and RPS with the formula below, not from anyone's blog table
What actually differs — and where each claim comes from
The reference workload: a product-catalog API (cache → DB → external pricing call) — request-response with mixed I/O, the shape most backend services actually are. Stack assumed throughout: Go 1.24 (Gin) vs Java 21 LTS (Spring Boot 3.4 with virtual threads[4] and ZGC[1] where noted), Java -Xmx512m and Go GOGC=100[5] as baselines. Those are the versions the harness repo pins and was verified on (its Go service routes with the standard library's net/http, not Gin) — re-run it on the Go and JDK releases you actually deploy. Every row below is either documented runtime behavior or something the harness at the end of this article measures on your hardware — none of it asks you to trust a stranger's load test.
| Metric | Go (Gin) | Java VT (JVM) | Java Native Image | Verify with |
|---|---|---|---|---|
| Throughput | No consistent winner vs Spring (servlet); lead flips by test type[2] | Virtual threads closed the concurrency gap[3] | Can trail JIT peak without PGO profiles[6] | k6 script below |
| GC pause ceiling | Sub-millisecond STW pause objective[7] | G1 targets 200ms by default[8]; ZGC documented sub-1ms[1] | Same collectors, smaller heaps | JFR / pprof commands below |
| Memory model | Heap target ≈ live heap × (1 + GOGC/100)[5] | -Xms heap touched up front with AlwaysPreTouch[8], plus metaspace and code cache | "A fraction of the resources" of the JVM, per GraalVM[9] | RSS under steady load |
| Cold start | Milliseconds — there is no VM to warm | Multi-second context construction + JIT warmup; Spring's CDS/AOT work exists to cut it[10] | Milliseconds, per GraalVM[9] | JMH cold-start bench below |
| Container density | Follows the low RSS floor | Follows the committed heap | Between the two | Density math below |
Memory and startup
The memory gap is the most reliable difference between the two runtimes, and it's structural rather than incidental. A JVM launched with -Xms512m -Xmx512m -XX:+AlwaysPreTouch commits its entire heap to physical memory before serving the first request[8] — and AlwaysPreTouch exists precisely to force that up front so you don't pay page-fault latency later.
Add metaspace, thread stacks, the JIT's compiled-code cache, and GC bookkeeping, and the resident set for a Spring service sits in the hundreds of MB regardless of how little data it's actually holding. A Go process has no equivalent floor: its heap target tracks live heap scaled by GOGC (default 100 ≈ "let the heap grow to 2× live set before collecting")[5], and RSS follows the heap.
That difference is wide enough that you don't need a contrived benchmark to see it — but you should measure your own, because the multiplier depends entirely on your heap settings and working set. Plug your own steady-state RSS into the density formula below before pricing anything.
Startup difference: this one is qualitative. A Go binary has no VM to warm — it's serving in milliseconds. A JVM Spring Boot service constructs its application context (component scanning, bean wiring, connection pools) and then climbs to peak throughput only after the JIT has compiled hot paths; Spring's own engineers measure cold start in seconds and have built CDS and AOT support to cut it[10]. Native Image flips the trade: startup drops to milliseconds[9], but, absent PGO, it loses the JIT's profile-driven optimization[6]. For scale-to-zero and aggressive autoscaling, Go's instant readiness is material; for long-lived processes, the JVM's JIT advantage accrues.
GC pause reality: this is where production latency diverges most, and the documented design targets tell the story without anyone needing to trust a blog's histogram. G1 — the JVM default — aims for a 200ms pause target out of the box, a soft goal you can lower[8]; those stop-the-world pauses are the spikes that show up at p99.9 and start "rewrite it in Go" debates.
ZGC (Java 21+) is documented to keep pauses under a millisecond by doing almost all its work concurrently[1], in exchange for some throughput. Go's stated GC objective (2018) is a 500 µs stop-the-world pause per cycle[7]. The honest summary: Go and ZGC both target sub-millisecond pauses; default G1 does not. The illustrative numbers in the diagram below reflect those design targets — confirm your own with the JFR and pprof commands below.
graph LR
    subgraph G1["JVM G1GC (default)"]
        G1A[p50: 5ms] --> G1B[p99: 18ms] --> G1C[p99.9: 47ms 🔥]
    end
    subgraph ZGC["JVM ZGC"]
        ZA[p50: 5ms] --> ZB[p99: 12ms] --> ZC[p99.9: ≈ p99, no GC spike]
    end
    subgraph GO["Go runtime GC"]
        GA[p50: 4ms] --> GB[p99: 8ms] --> GC[p99.9: ≈ p99, no GC spike]
    end
In this illustration, the G1 p99.9 spike drives the "rewrite in Go" question; ZGC removes long GC pauses as its source without a rewrite.
GC tuning: choose your trade-off
Go: Two knobs only. GOGC=100 (default, collect when heap doubles), GOMEMLIMIT=256MiB (soft ceiling)[5]. Done. No misconfiguration surface.
Java G1GC: Use -XX:MaxGCPauseMillis=50 to target pause time (best effort, not guaranteed). Works for most services. When tens-of-ms pauses matter, switch to ZGC.
Java ZGC: -XX:+UseZGC for sub-millisecond pauses[1]. The trade is throughput: collecting concurrently costs CPU cycles that G1 spends on application work, so expect lower peak throughput in exchange for a flat latency tail. Use when P99.9 is an SLO. Generational ZGC was opt-in via -XX:+ZGenerational in JDK 21–22, became the default in JDK 23, and is the only mode from JDK 24 on (the flag is now obsolete)[1]. So on JDK 23+ -XX:+UseZGC alone gives you the generational collector, but on the harness's Java 21 it still selects the non-generational one — add -XX:+ZGenerational there. Generational mode narrows the throughput gap on workloads dominated by short-lived allocations. Measure it on your own allocation profile rather than assuming older non-generational ZGC numbers still apply.
Go's latency is consistent without tuning; Java's requires choosing between throughput and tail latency.
Code example: both stacks side by side
func (h *ProductHandler) Get(c *gin.Context) {
    id, err := strconv.ParseInt(c.Param("id"), 10, 64)
    if err != nil {
        c.JSON(http.StatusBadRequest, gin.H{"error": "invalid product id"})
        return
    }
    ctx := c.Request.Context()
    key := fmt.Sprintf("p:%d", id)

    // Cache → DB → pricing API. redis.Nil means "not cached" — expected,
    // not an error. Any other cache error falls through to the DB instead
    // of failing the request over a Redis blip.
    if cached, err := h.redis.Get(ctx, key).Bytes(); err == nil {
        c.Data(http.StatusOK, "application/json", cached)
        return
    } else if !errors.Is(err, redis.Nil) {
        slog.WarnContext(ctx, "cache read failed", "key", key, "err", err)
    }

    product, err := h.repo.GetByID(ctx, id)
    if err != nil {
        if errors.Is(err, pgx.ErrNoRows) {
            c.JSON(http.StatusNotFound, gin.H{"error": "product not found"})
            return
        }
        slog.ErrorContext(ctx, "product lookup failed", "id", id, "err", err)
        c.JSON(http.StatusInternalServerError, gin.H{"error": "lookup failed"})
        return
    }

    price, err := h.pricing.Get(ctx, product.SKU)
    if err != nil {
        slog.ErrorContext(ctx, "pricing call failed", "sku", product.SKU, "err", err)
        c.JSON(http.StatusBadGateway, gin.H{"error": "pricing service unavailable"})
        return
    }
    product.Price = price

    data, err := json.Marshal(product)
    if err != nil {
        slog.ErrorContext(ctx, "product encoding failed", "id", id, "err", err)
        c.JSON(http.StatusInternalServerError, gin.H{"error": "encoding failed"})
        return
    }
    if err := h.redis.Set(ctx, key, data, 5*time.Minute).Err(); err != nil {
        slog.WarnContext(ctx, "cache write failed", "key", key, "err", err)
    }
    c.JSON(http.StatusOK, product)
}Both run the same cache → DB → pricing path and return 404 for an unknown id. The Go handler spells out every other failure inline — a Redis blip falls through to the DB, a pricing outage is a 502 — while the Java controller lets those surface as exceptions to Spring's error handling, a 500 unless you map them in a @ControllerAdvice. Go's simpler API surface; Java's annotation-driven DI. Cognitive load is comparable.
Java (Spring Boot) vs. Go (Gin) Framework Comparison
Between Spring Boot and Gin specifically, the trade-off is architectural complexity, runtime behavior, and developer productivity:
- Framework Weight: Spring Boot is a full-featured enterprise framework with built-in dependency injection, ORM, security, and transaction management, which adds class-loading and committed-heap overhead — typically hundreds of MB of RSS. Gin is a lightweight, minimalist HTTP web framework focused purely on routing and middleware, so its footprint tracks the low Go RSS floor described above.
- Execution Model: Spring Boot uses an annotation-driven, reflection-heavy model that dynamically constructs the application context at startup — the multi-second cold start Spring's own team works to reduce[10]. Gin uses direct compiled Go code with no runtime reflection in the hot path, so there is no warmup phase.
- Throughput vs. Simplicity: in TechEmpower Round 23 Gin leads JSON and plaintext, Spring (servlet) the heavier DB tests (TFB's Gin entry uses MySQL, Spring's Postgres)[2]. Virtual threads removed Java's old blocking-I/O concurrency penalty[3]; the remaining difference is framework complexity and the memory/startup profile rather than a consistent requests-per-second winner.
Cost and density
For memory-bound services, cost is downstream of the RSS floor through one formula — and it's worth computing with your own numbers rather than quoting anyone's:
instances_per_host = floor(host_usable_memory / per_instance_RSS)
monthly_cost       = ceil(peak_concurrent_instances / instances_per_host) × host_monthly_price
The lever is per_instance_RSS, and that's exactly where the runtimes diverge. Worked example (plug in your own measured RSS): take a host with ~7 GB usable RAM. A Go service holding ~70 MB packs ~100 instances onto it; a JVM service pinned at -Xmx512m with AlwaysPreTouch commits ~600 MB once you add metaspace and code cache, so the same host holds ~11. That ~8–9× density gap is the structural memory difference from the previous section turned into a bin-packing result — not a measured benchmark, a consequence of the committed-heap model.
Three caveats that determine whether the gap is real money for you:
- It only bites when you're memory-bound. If your services are CPU-bound or pinned at low replica counts for availability rather than load, per-instance RSS never becomes the limiting dimension and the cost gap shrinks to noise.
- Right-size the JVM heap. A Spring service that genuinely needs 512 MB of live heap won't shrink; but many are over-provisioned. Measure live heap under load and set
-Xmxto fit before concluding Go is "cheaper." - Native Image changes the inputs. GraalVM's lower memory footprint[9] raises JVM-side density toward Go's range at the cost of JIT peak throughput.
The cost/startup/latency trade-off, by the SLO that should actually drive the choice:
graph LR
    Decision{"What drives<br/>the decision?"}
    Decision -->|"memory density<br/>+ instant startup"| Go["Go<br/>low RSS floor<br/>ms cold start<br/>sub-ms GC pauses"]
    Decision -->|"scale-to-zero<br/>cold-start latency"| NativeJ["Java Native Image<br/>JVM-beating startup<br/>below-JIT peak throughput"]
    Decision -->|"long-lived process<br/>tail-latency SLO"| ZGC["Java JVM + ZGC<br/>sub-ms pauses<br/>throughput cost"]
    Decision -->|"long-lived process<br/>throughput-first"| G1["Java JVM + G1GC<br/>highest JIT throughput<br/>tens-of-ms pause tail"]
    style Go fill:#dfd
    style NativeJ fill:#ddf
    style ZGC fill:#ffd
    style G1 fill:#fdd
The diagram is the editorial answer to "which is faster": none of them, until you pick the SLO. Go wins on density and startup; ZGC wins on tail latency; Native Image wins on cold-start; G1 wins on raw throughput when you can absorb a tens-of-ms pause tail. Run the harness at the end of this article to put real numbers on each box for your workload before quoting any of it.
Ecosystem depth
Java edges: Hibernate/Spring Data for complex entity models (80+ types, rich relationships), Spring AI for LLM/RAG, Spring Kafka/Camel for event streaming, legacy integration (SOAP, EDI, mainframe).
Go edges: Single go binary toolchain (go build, test, fmt, vet) with little config surface to stand up a service. Goroutines are simpler than Java threads for most concurrency. Single static binary deploys cleanly as a CLI, sidecar, or proxy.
Comparable: HTTP frameworks (Gin ≈ Spring MVC), gRPC, databases (pgx ≈ JDBC), testing (testify ≈ JUnit).
Production checklist
- Use Go if: request-response at scale, most of your services fit HTTP+DB+cache, memory density is a real line item, team has Go experience
- Use Java if: complex domain model (rich entity graphs), LLM/vector DB integration planned, team is Java-first with no Go experience — team velocity dwarfs any same-class throughput difference
- Use Java Native Image if: autoscaling matters more than peak throughput (serverless, scale-to-zero), startup is an SLO
- Use Java ZGC if: P99.9 latency is an SLO and you have CPU headroom for the throughput penalty
- Never choose on a same-class throughput delta alone: when the two runtimes land in the same throughput class on your workload, the deciding factors are memory cost, tail-latency SLO, and team fluency — not requests per second. A language switch is a multi-month productivity hit for a senior team; the runtime has to be wrong for a structural reason (memory floor, GC tail, cold start) to justify it.
Picture the textbook version of this mistake: a team rewrote a Spring service in Go after seeing a "3× throughput" number from a microbenchmark — a JSON-serialization loop with no I/O. The Go version shipped faster, started faster, used less memory. Victory, right? Except the service was CPU-bound on a PDF rendering library that had a mature, optimised Java implementation and a barely-maintained Go port.
In that hypothetical, the Go version's p99 increased by 40% on the hot path, and the team spent two months writing a CGo wrapper around a C PDF library before giving up and reverting. The lesson: the throughput delta on your actual hot path is the only number that matters, not a framework-level microbenchmark. The benchmark harness below exists so you measure your service, not a stranger's loop.
Benchmark methodology — the harness, so you measure your own
This is the part to actually use. Rather than ask you to trust numbers from hardware you can't see, this section is the reproducible harness: a load driver, a controlled environment spec, profiling commands, and a cold-start rig. The whole thing is published as a runnable repo — backendbytes/go-vs-java-benchmark — with both services implemented, identical container budgets, and a deterministic seed; docker compose up --build and you're measuring. Run it against your infrastructure and the deciding numbers are yours — which is the only honest way to settle a runtime choice.
The k6 driver script — copy-paste reproducible:
// k6 driver: ramp 0 → 500 VUs over 60s, hold 8m, ramp down 1m.
// Steady-state 8-minute window is the one to report; the ramp is discarded.
import http from "k6/http";
import { check, sleep } from "k6";

export const options = {
  scenarios: {
    catalog_read: {
      executor: "ramping-vus",
      startVUs: 0,
      stages: [
        { duration: "60s", target: 500 },   // ramp up — discarded
        { duration: "8m",  target: 500 },   // steady — measured
        { duration: "1m",  target: 0 },     // ramp down — discarded
      ],
      gracefulRampDown: "30s",
    },
  },
  thresholds: {
    http_req_duration: ["p(99)<500"],       // SLO assertion in CI
    http_req_failed: ["rate<0.005"],
  },
};

const BASE = __ENV.TARGET || "http://api:8080";

export default function () {
  const id = 1 + (__ITER % 10000);             // 10k-key working set
  const res = http.get(`${BASE}/products/${id}`);
  check(res, { "status is 200": (r) => r.status === 200 });
}
A controlled setup so your numbers mean something:
- Service: a product-catalog REST API is a good reference shape.
GET /products/{id}reads from Redis, falls back to Postgres, then calls a stub pricing service — identical schema and seed data in both stacks. Match your own service's I/O ratio if you can. - Hardware: pick one host shape (e.g. 2 vCPU / 4 GB) and give Go and Java the identical task-definition budget so the only varying axis is the runtime. Single-AZ removes cross-AZ jitter from p99.
- Backing services: shared, pre-warmed Postgres and Redis. Cold caches bias the first stack you test.
- Driver: run
k6from a separate host, ramp 0 → 500 VUs over 60 s, hold 8 minutes, ramp down. Report the steady-state window only — excluding warm-up is what keeps JVM JIT settling from biasing the Java numbers. - JVM flags: baseline
-Xms512m -Xmx512m -XX:+UseG1GC -XX:MaxGCPauseMillis=50 -XX:+AlwaysPreTouch; ZGC variant swaps to-XX:+UseZGC[1]. Virtual threads viaspring.threads.virtual.enabled=true[4]. - Go flags:
GOGC=100,GOMEMLIMIT=512MiB[5], default scheduler. LeaveGOMAXPROCSunset where the platform exposes CPU limits Go reads correctly. - What this shape does NOT cover: heavy CPU loops (where JIT speculation pays the most), large-heap workloads (>4 GB, where ZGC's design wins flip relative to G1), heavy reflection, batch/streaming pipelines. Microservice request-response is the one shape this harness targets — re-run before generalising to anything else.
- Statistics that make a result trustworthy: take the median of at least 5 runs, report run-to-run variance alongside the median, and discard any run with an environmental fault (a Spot interruption, a noisy neighbour) rather than letting it skew the result. A single run is an anecdote, not a measurement.
Profiling commands for both stacks
The honest answer to "which is faster on my workload" lives in flame graphs, not blog claims. Capture both stacks under the load above with these — copy-pasteable for either:
# Java: capture a 30-second JFR profile under load
jcmd <pid> JFR.start name=loadtest duration=30s filename=loadtest.jfr settings=profile

# Open in Java Mission Control
jmc loadtest.jfr

# Allocation flame graph (no overhead — sampling JVMTI)
java -XX:StartFlightRecording=duration=30s,filename=alloc.jfr,settings=profile \
     -XX:+UnlockExperimentalVMOptions \
     -jar app.jar
# Go: pprof against a running server with net/http/pprof enabled
go tool pprof -http=:8081 http://localhost:6060/debug/pprof/profile?seconds=30
# Heap allocations (production-safe at low overhead)
go tool pprof -http=:8082 http://localhost:6060/debug/pprof/heap
# Goroutine stack trace (instant — no sampling)
curl http://localhost:6060/debug/pprof/goroutine?debug=2 > goroutines.txtBoth produce flame graphs of CPU and allocation hot spots, and both run in production with negligible overhead.
Benchmark harness you can clone and run
If you only take one section from this article, take this one. The harness below is the smallest reproducible setup that rules out the usual benchmark-blog mistakes — different hardware shapes, mismatched backing services, missing warm-up, and infra cost calculations done in a spreadsheet days later. Everything in this section lives, fully implemented and verified end-to-end, at backendbytes/go-vs-java-benchmark — clone it instead of pasting.
Start by standing up both services with shared backing infrastructure so the only varying axis is the runtime. The compose file below pins identical container budgets, an identical Postgres seed, and an identical Redis for both stacks. Run docker compose up, point your load driver at port 8080 for Go and 8081 for Java, and you can generate every number this article talks about on a laptop — for your own service, not ours:
# docker-compose.yml — apples-to-apples local harness for Go vs JVM benchmarking
version: "3.9"
services:
  postgres:
    image: postgres:16-alpine
    environment:
      POSTGRES_PASSWORD: bench
      POSTGRES_DB: catalog
    volumes:
      - ./seed.sql:/docker-entrypoint-initdb.d/seed.sql:ro
    deploy:
      resources:
        limits: { cpus: "2.0", memory: 1G }

  redis:
    image: redis:7-alpine
    command: ["redis-server", "--maxmemory", "256mb", "--maxmemory-policy", "allkeys-lru"]
    deploy:
      resources:
        limits: { cpus: "0.5", memory: 320M }

  catalog-go:
    image: ghcr.io/example/catalog-go:1.24
    environment:
      DB_DSN: "postgres://postgres:bench@postgres:5432/catalog?sslmode=disable"
      REDIS_ADDR: "redis:6379"
      GOGC: "100"
      GOMEMLIMIT: "512MiB"
    ports: ["8080:8080"]
    depends_on: [postgres, redis]
    deploy:
      resources:
        limits: { cpus: "2.0", memory: 512M }

  catalog-java:
    image: ghcr.io/example/catalog-spring:21
    environment:
      JDK_JAVA_OPTIONS: >-
        -Xms512m -Xmx512m -XX:+UseZGC
        -XX:+AlwaysPreTouch -XX:+UseStringDeduplication
      SPRING_THREADS_VIRTUAL_ENABLED: "true"
      SPRING_DATASOURCE_URL: "jdbc:postgresql://postgres:5432/catalog"
      SPRING_REDIS_HOST: "redis"
    ports: ["8081:8080"]
    depends_on: [postgres, redis]
    deploy:
      resources:
        limits: { cpus: "2.0", memory: 768M }
Holding cpus, memory, and the backing-service container shape constant across both services is the only honest way to compare. Bumping the Java container's memory ceiling above 768MB to "make it fairer" silently changes ZGC's behaviour and biases throughput in Java's favour.
Once both services are warm, drive them with a load tool that reports tail latency rather than averages — wrk is fine for steady-state, but vegeta produces the kind of histogram CSV you can diff between runs. The script below ramps each service for 60 seconds (discarded), holds steady for 8 minutes (reported), and writes per-run latency histograms so you can prove p99.9 differences are real and not run-to-run noise:
#!/usr/bin/env bash
# bench.sh — drive both stacks with vegeta, write histograms.
# Usage: ./bench.sh go 8080  ||  ./bench.sh java 8081
set -euo pipefail
NAME="${1:?stack name (go|java)}"
PORT="${2:?port}"
OUT="results/${NAME}-$(date -u +%Y%m%dT%H%M%SZ)"
mkdir -p "${OUT}"

# Warm-up — discarded so JIT settles before measurement.
echo "GET http://localhost:${PORT}/products/$((RANDOM % 10000 + 1))" \
  | vegeta attack -duration=60s -rate=200 > /dev/null

# Steady-state — reported window. Open-loop, fixed RPS so tail latency
# reflects the service, not the driver.
jq -nc --argjson n 10000 \
  '[range(1; $n)] | map({method:"GET", url:"http://localhost:'"${PORT}"'/products/\(.)"} )' \
  | vegeta attack -targets=- -rate=2500 -duration=8m -workers=200 \
  | tee "${OUT}/raw.bin" \
  | vegeta report -type=hist -buckets='[0,5ms,10ms,25ms,50ms,100ms,250ms,500ms]' \
  | tee "${OUT}/histogram.txt"

vegeta report -type=json < "${OUT}/raw.bin" > "${OUT}/summary.json"
echo "Wrote ${OUT}/{raw.bin,histogram.txt,summary.json}"
Open-loop load (-rate=2500) is critical: closed-loop tools (a fixed worker pool that waits for each response) under-report tail latency because slow responses gate the next request, so a stalled GC cycle is hidden behind reduced throughput rather than surfaced as a p99.9 spike. If your benchmark uses wrk defaults, you are measuring throughput-under-coordinated-omission, not the latency your users experience.
Once you have summary JSON for both runs, the cost-per-RPS comparison should live in the same monitoring stack the service runs in — not a spreadsheet that goes stale after the next deploy. The Prometheus recording rule below computes a rolling cost-per-million-requests for each service from container CPU usage and a static $/vCPU/hour constant; it makes the Go-vs-Java cost gap a Grafana panel, not an annual finance exercise:
# prometheus-cost-rules.yml — cost-per-million-requests, per service, per runtime.
# Wire this in via rule_files in prometheus.yml and label your services with
# `runtime="go"` or `runtime="jvm"` so the gap shows up split by stack.
groups:
  - name: cost_per_rps
    interval: 30s
    rules:
      - record: service:cpu_seconds:rate5m
        expr: sum by (service, runtime) (
                rate(container_cpu_usage_seconds_total{container!="POD",service!=""}[5m])
              )

      - record: service:requests:rate5m
        expr: sum by (service, runtime) (
                rate(http_requests_total{status!~"5.."}[5m])
              )

      # Fargate Graviton list price as of writing — replace with your
      # negotiated rate or a reserved-instance amortisation. The point is
      # that the constant lives in one place, not 50 spreadsheets.
      - record: service:fargate_usd_per_vcpu_second
        expr: vector(0.04048 / 3600)

      - record: service:cost_per_million_requests
        expr: (service:cpu_seconds:rate5m * service:fargate_usd_per_vcpu_second * 1e6)
              / clamp_min(service:requests:rate5m, 1)

      - alert: RuntimeCostRegression
        expr: (service:cost_per_million_requests
                / on(service) group_left()
                avg_over_time(service:cost_per_million_requests[7d])) > 1.25
        for: 30m
        labels: { severity: warning }
        annotations:
          summary: "{{ $labels.service }} cost-per-Mreq is 25% above its 7-day baseline"
          description: "Likely causes: GC tuning regression, heap leak, or a hot path
                       that allocates per request. Check the JFR/pprof flame graph."
``` <Cite id="prometheus-best-practices" n="11" />

The `RuntimeCostRegression` alert is the one that catches the regressions a weekly review never would — a Spring Boot upgrade that flipped the default GC, a new endpoint that allocates a `byte[]` per request, a Go release that changed `GOGC` semantics. The cost-per-million is the single number a finance partner cares about, and a recording rule makes it cheap to query at any rollup.

Cold-start latency is the one number `wrk`/`vegeta` cannot measure — they assume the server is already up. The JMH-style harness below is the smallest setup that produces a reproducible cold-start histogram for the JVM by killing and restarting the process between iterations; the same pattern works for Go (replace `java -jar` with the binary path) and for Native Image. Run it before claiming "X starts in Yms":

```java
// ColdStartBench.java — JMH benchmark that measures end-to-end cold start.
// Each invocation forks a fresh JVM, so JIT state, class loading, and page
// cache warmth do NOT carry over between iterations. This is what real
// scale-to-zero traffic experiences.
@BenchmarkMode(Mode.SingleShotTime)
@OutputTimeUnit(TimeUnit.MILLISECONDS)
@Fork(value = 25, jvmArgs = {"-Xms512m", "-Xmx512m", "-XX:+UseZGC"})
@Warmup(iterations = 0)        // no warm-up — cold start is the point
@Measurement(iterations = 1)
@State(Scope.Benchmark)
public class ColdStartBench {

    @Benchmark
    public void timeToFirstSuccessfulRequest(Blackhole bh) throws Exception {
        long start = System.nanoTime();
        Process p = new ProcessBuilder(
                "java", "-Xms512m", "-Xmx512m",
                "-XX:+UseZGC",
                "-jar", "services/catalog-java/target/catalog-spring-1.0.0.jar")
            .redirectErrorStream(true)
            .start();

        try (HttpClient client = HttpClient.newHttpClient()) {
            // Spring Boot Actuator serves health at /actuator/health, not /health.
            HttpRequest probe = HttpRequest.newBuilder(URI.create("http://localhost:8080/actuator/health"))
                .timeout(Duration.ofMillis(200))
                .build();

            // Poll every 25ms until first 200 OK — that is the moment the
            // service is actually serving traffic, not just when the JVM
            // printed "Started" to stdout. Connection refused is expected
            // while it boots; a dead process or a missed deadline fails the
            // fork instead of hanging it.
            long deadline = start + TimeUnit.SECONDS.toNanos(60);
            IOException lastFailure = null;
            while (true) {
                if (!p.isAlive()) {
                    throw new IllegalStateException("service exited early, code " + p.exitValue());
                }
                if (System.nanoTime() > deadline) {
                    throw new IllegalStateException("not ready within 60s", lastFailure);
                }
                try {
                    if (client.send(probe, BodyHandlers.discarding()).statusCode() == 200) break;
                } catch (IOException notReadyYet) {
                    lastFailure = notReadyYet;
                }
                Thread.sleep(25);
            }
            long elapsedMs = (System.nanoTime() - start) / 1_000_000;
            bh.consume(elapsedMs);
        } finally {
            p.destroy();
            p.waitFor(5, TimeUnit.SECONDS);
        }
    }
}
Two details that benchmarks usually miss: (1) time to "Started Application" in the JVM log is not time-to-first-200 — the gap is often several hundred ms while connection pools warm, so measure against a real /actuator/health probe; (2) running 25 forks rather than 3 is what surfaces the long tail, since a cold filesystem cache can add a second or more to a single run. Report the median and the p95 of the forks — if your autoscaler's readiness timeout sits near the p95, that tail is what causes the 502 bursts, not the median.
Frequently Asked Questions
Is Go faster than Java in 2026?
It depends on the workload. Go has faster cold starts (no JVM warmup) and lower memory overhead, making it a better fit for CLI tools, serverless, and dense container fleets. On raw throughput neither wins every test — in TechEmpower Round 23 the lead between Gin and Spring (servlet) flips by test type[2] — and virtual threads help Java on high-concurrency blocking I/O, not CPU-bound work[3]. Benchmark your workload with this article's harness.
Should I choose Go or Java for microservices?
Choose Go for lightweight, high-concurrency services where fast startup, small container images, and low memory matter (edge services, API gateways). Choose Java for complex business logic services where the mature ecosystem (Spring, Hibernate, testing frameworks) accelerates development and maintainability.
Keep Reading
- Java Virtual Threads: Project Loom, Pinning Hazards, and Production Migration — Deep dive into virtual thread scheduling, pinning rules, and the migration pitfalls this benchmark glosses over
- GraalVM Native Images in Production: From 5-Second Startup to 50ms — The full story on native image trade-offs: what breaks, PGO tuning, and whether the startup win justifies the throughput cost
- Go Worker Pool Pattern: Production-Ready Concurrency Control — How Go's goroutine advantage translates into practical worker pool patterns with backpressure and bounded concurrency
Coming Next
In our next deep dive, we shift from CPU benchmarks to the memory management subsystem. We will analyze the performance of Go 1.26's new Green Tea garbage collector under heavy heap allocation rates, comparing it to standard Go GC and Java's ZGC. Read the Go Green Tea GC deep dive or subscribe to our newsletter to get notified on release.
Sources
- 1.Z Garbage Collector — Wiki and Generational ZGC documentation — OpenJDK, 2026
- 2.TechEmpower Framework Benchmarks Round 23 — physical-hardware results (raw data) — TechEmpower, 2025
- 3.JEP 444: Virtual Threads — OpenJDK, 2023
- 4.Spring Boot 3.2+ — Virtual Threads support and configuration — Spring Documentation, 2026
- 5.Go runtime — Garbage Collector Guide (GOGC, GOMEMLIMIT, soft memory limit) — Go Documentation, 2026
- 6.Profile-Guided Optimization — GraalVM Native Image Reference Manual — Oracle / GraalVM, 2026
- 7.Getting to Go: The Journey of Go's Garbage Collector — The Go Blog (go.dev), 2018
- 8.The java Command — Java SE 21 Tools Reference — Oracle Java Documentation, 2023
- 9.GraalVM Native Image Documentation — Oracle / GraalVM, 2026
- 10.Spring Boot CDS support and Project Leyden anticipation — spring.io, 2024
- 11.Prometheus — Histograms, Summaries, and Labels Best Practices — Prometheus Project, 2026
Engineering Team
An independent engineering publication covering distributed systems, databases, and production infrastructure. Every factual claim is cited to a primary source or removed.
Read Next
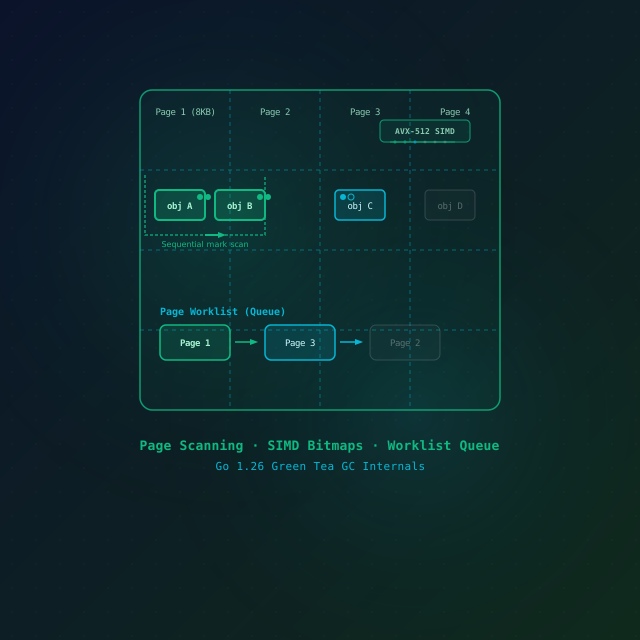
Go 1.26 Green Tea GC in Production: What Changes, How to Measure It, When to Opt Out
Go 1.26 makes the Green Tea garbage collector the default. What actually changed, how to measure GC CPU before and after on your own workload, and the short window you have to opt out.
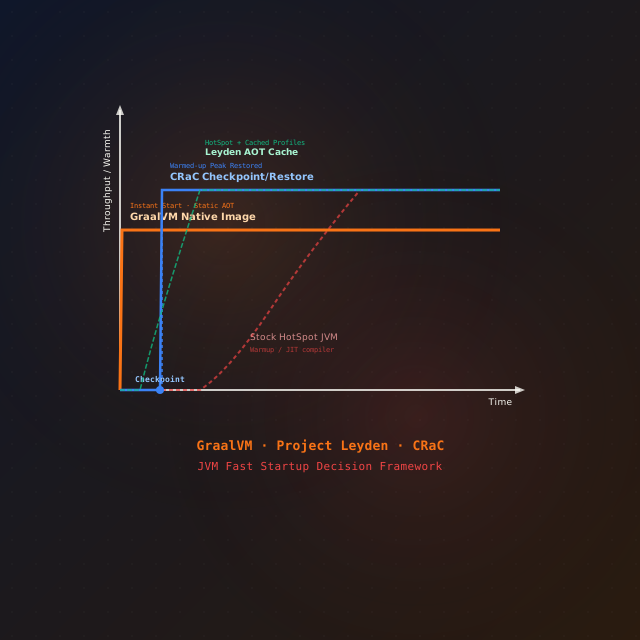
JVM Cold Start in 2026: Leyden vs GraalVM Native Image vs CRaC
Slow JVM cold start breaks scale-to-zero and autoscaling. Three ways to fix it in 2026 — Project Leyden's AOT cache, GraalVM Native Image, and CRaC — with the exact commands, the trade-offs, and a decision framework.

Java Virtual Threads: Project Loom, Pinning Hazards, and Production Migration
Java 21 virtual threads: M:N scheduling, pinning hazards, ThreadLocal pitfalls, JFR detection, and what migration really takes.