GraalVM Native Images in Production: From Seconds to Milliseconds

Lesson 2 of 6
A 2-second readiness SLA. A 7-second cold start. Every rolling deploy, a burst of 502s. That gap is where a Spring Boot service on Kubernetes goes to die: pods miss the readiness window on every rollout and autoscaling event. It's the canonical case GraalVM native image is built for — startup drops to milliseconds and the runtime memory footprint falls sharply[1], in exchange for a steady-state throughput penalty and the closed-world constraints this article walks through.
GraalVM native images eliminate the JVM at runtime, cutting startup from seconds to milliseconds[1]. Trade-off: the closed-world assumption requires explicit reflection hints, and throughput at steady state is typically lower than JIT because the AOT compiler can't profile-and-speculate the way the JIT does. Use native images for Kubernetes scale-to-zero workloads; skip them for heavy reflection or batch processing.
- Millisecond startup cuts K8s readiness SLAs from many seconds to well under one
- Memory footprint drops substantially — GraalVM documents that native images use "a fraction of the resources required by the Java Virtual Machine"[1]
- Reflection hints are mandatory — closure at build time breaks dynamic code, JPA, dynamic proxies
When to Use Native Image: The Quick-Start Table
The decision to migrate to native images is fundamentally a question of your deployment model and constraints. The ranges below are illustrative — the shape this trade-off typically takes, not a benchmark for any one service. Evaluate your own workload against this matrix, then measure:
| Factor | JVM JAR | Native Image | Containerized JVM (CDS) |
|---|---|---|---|
| Startup time | 4–11s | 40–120ms | ~2.7–7s (≈1.5× faster) |
| Peak throughput | Highest (after warmup) | 10–25% lower | Same as JVM |
| Memory (RSS) | 350–550MB | 80–150MB | 300–450MB |
| Image size | 300–420MB | 55–95MB | 250–350MB |
| Build time | 10–30s | 8–15min | 30–60s |
| Reflection support | Works out-of-box | Requires explicit hints | Works out-of-box |
| Debugging tools | Full JVM ecosystem | Limited (thread dumps, partial JFR) | Full JVM ecosystem |
| Best use case | Long-running services, throughput-critical | K8s scale-in-out, serverless, memory-constrained | Cost-conscious services |
Use native images when: pod lifetime is under 15 minutes, startup SLA is strict (< 2 seconds), or you're running at scale where memory per pod compounds into infrastructure cost.
Use the JVM when: services run for hours/days (batch, background jobs), you need peak throughput (long warm-up acceptable), or you rely heavily on reflection (complex JPA, AspectJ load-time weaving).
Consider Class Data Sharing (CDS) as a middle ground. Spring Boot 3.3+ supports CDS: a one-time training run records the loaded classes into an archive that the JVM memory-maps on subsequent starts — no code changes, full JVM compatibility. Spring measured ~1.5× faster startup on a minimal app, with similar gains on Petclinic[2] (the training run is automated when you build with Buildpacks and set BP_JVM_CDS_ENABLED=true). It won't match native image startup, but it preserves debugging tooling and doesn't require reflection hints — often the sweet spot for teams unsure about the native image commitment.
Two efforts are closing the startup gap without the closed-world tax. Project Leyden extends CDS into an AOT cache: JEP 483 (JDK 24) caches loaded-and-linked classes, JEP 515 (JDK 25) adds method profiles so the JIT starts compiling hot paths at boot, and JEP 516 (JDK 26) makes the object cache GC-agnostic — unblocking ZGC.
These run on the ordinary HotSpot JVM, so reflection, dynamic class loading, and full debugging tooling keep working; a training run produces the cache. CRaC (Coordinated Restore at Checkpoint) takes a different route — snapshot a warmed-up JVM and restore it in milliseconds with JIT-compiled code already in place; Spring Boot, Micronaut, and Quarkus support it, though it's Linux-only and not yet GA.
This doesn't make native image obsolete — it sharpens the choice. Native image still wins on absolute memory footprint (illustratively 80–150MB RSS vs the JVM's 300MB+ in the table above) and a single self-contained binary with no JVM at runtime. Reach for Leyden/CDS or CRaC when you want faster starts but can't pay the reflection-metadata and lost-tooling cost; reach for native image when memory density and minimal attack surface are the goal.
How Native Image Works: Static Analysis vs JIT
Traditional JVM (JIT): Bytecode compiled at build time, executed via interpreter at runtime. JIT profiles hot paths and compiles them to optimized machine code. Performance improves over time — a 10-minute-old JVM is significantly faster than one that just started.
GraalVM Native Image (AOT): GraalVM performs static analysis at build time (the "closed-world assumption")[1], builds a reachability graph, and produces a self-contained native binary. No JVM, no interpreter, no JIT, no class loading. All code is pre-compiled to optimized machine code. The binary starts instantly.
graph TD
    subgraph JVM ["Traditional JVM - JIT"]
        direction TB
        B1[Source Code] -->|javac| B2[Bytecode]
        B2 --> B3[JVM Startup<br/>~4-11 seconds]
        B3 --> B4[Interpreter] -->|Hot Paths| B5[JIT Compiler]
        B5 --> B6[Optimized Machine Code<br/>Peak at ~5min]
    end

    subgraph Native ["GraalVM Native - AOT"]
        direction TB
        N1[Source Code] -->|javac| N2[Bytecode]
        N2 -->|native-image<br/>Static Analysis| N3[Closed-World Build<br/>minutes, not seconds]
        N3 --> N4[Native Binary<br/>Self-contained]
        N4 --> N5[Pre-Optimized Code<br/>Ready immediately]
    end
The closed-world assumption is the fundamental constraint. The compiler must know about everything at build time. Normal method calls, inheritance, and allocations work fine. But reflection breaks — the compiler cannot know which classes will be instantiated via Class.forName() at runtime. Same issue applies to JNI, dynamic class loading, and runtime proxy generation. This is where most teams hit their first wall. [1]
The Throughput Reality: JIT vs AOT vs PGO
JIT warm-up produces better peak throughput because the JIT observes actual runtime behavior — which branches are taken, which methods are hot, which types flow through call sites. The JVM makes speculative optimizations based on observed patterns. But this comes at a cost. For a Spring Boot service on Java 21 (single endpoint, 8-core host) the warm-up curve has a characteristic shape. The numbers below are illustrative of that shape, not a benchmark result:
- 0–10s: ~4,000 req/s (interpreting bytecode, minimal optimization)
- 10–30s: ~12,000 req/s (C1 compiler kicks in, basic optimizations)
- 30s–2min: ~20,000 req/s (C2 compiler, inlining, escape analysis)
- 5min+: ~28,000 req/s (fully warmed, speculative optimizations like branch prediction)
For long-running services (hours/days), peak JIT throughput typically exceeds AOT because the JIT optimizes on profiling data from the running program — which branches are taken, which call sites to inline — that a static AOT compiler lacks[3]. The gap is workload-dependent; measure it on your own service with the JMH and load-test approach in the Go vs Java benchmark harness rather than assuming a fixed percentage.
AOT (native image) on the same illustrative curve delivers ~22,000 req/s immediately — no warm-up. The ceiling is lower because the AOT compiler must make conservative decisions. For services scaling in/out frequently (K8s HPA), the total requests served during JIT warm-up at reduced throughput may exceed the steady-state gap. If pod lifetime is under 15 minutes, AOT often serves more total requests than JIT in the same window.
PGO (Profile-Guided Optimization) — available in Oracle GraalVM — narrows the gap by feeding real execution profiles back into the AOT compiler:
# Step 1: Build an instrumented binary that records execution profiles
native-image --pgo-instrument -jar app.jar -o app-instrumented

# Step 2: Run under realistic load to generate profiles
./app-instrumented &
k6 run load-test.js  # Exercise all code paths — mimic production traffic
# Profiles written to default.iprof on exit

# Step 3: Build the optimized binary using the collected profiles
native-image --pgo=default.iprof -jar app.jar -o app-optimized
PGO gives the AOT compiler the same kind of runtime profile data that the JIT uses — hot methods, taken branches, type profiles at call sites — so Oracle GraalVM's PGO improves the quality of the AOT compiler's output[3] — how much of the gap it closes is workload-dependent. Trade-off: you need a representative workload for profiling. If your production traffic patterns differ significantly from the profiling run, the optimization may not help — or could regress performance on uncommon paths. Profile against captured production traffic, not a synthetic happy path.
The Closed-World Problem: Reflection Hints in Practice
The biggest production trap is reflection. Here's a concrete example. A service uses Jackson to deserialize JSON from Kafka messages — standard stuff. The Jackson ObjectMapper uses reflection internally to discover fields and constructors on your model classes. In a standard JVM, this works fine because the JVM allows dynamic discovery at runtime. In a native image, GraalVM's static analysis happens at build time and cannot "see" that these classes will be instantiated via reflection, so they get excluded from the binary[1].
Runtime result: ClassNotFoundException: OrderEvent when the first message arrives, at 2 AM, in production.
Reflection is pervasive in Java frameworks. Jackson does it for JSON deserialization. Hibernate does it to discover entity fields and their mappings. Spring AOP uses bytecode generation (CGLIB) to create proxies. Spring Data repository interfaces are created via reflection. All of these "just work" on the JVM because reflection is allowed. On native image, they require explicit hints.
The fix: tell GraalVM what gets accessed via reflection. You have two main approaches:
// Option 1: Annotation-based (cleanest for Spring)
@RegisterReflectionForBinding(OrderEvent.class)
@Configuration
public class KafkaConfig { }

// Option 2: RuntimeHintsRegistrar for third-party classes you don't own
@Configuration
@ImportRuntimeHints(MyRuntimeHints.class)
public class AppConfig { }

public class MyRuntimeHints implements RuntimeHintsRegistrar {
    @Override
    public void registerHints(RuntimeHints hints, ClassLoader classLoader) {
        // Register classes for reflection
        hints.reflection()
            .registerType(ThirdPartyDto.class,
                MemberCategory.INVOKE_DECLARED_CONSTRUCTORS,
                MemberCategory.DECLARED_FIELDS);

        // Register resource files
        hints.resources()
            .registerPattern("email-templates/*.html")
            .registerPattern("db/migration/*.sql");
    }
}
Spring Boot 3.x has done substantial work here. The Spring AOT (Ahead-Of-Time) processor auto-generates hints for most Spring-managed beans: @Component, @Service, @Repository, @Entity, @ConfigurationProperties. If you use only Spring beans and don't do anything exotic, you might get away with minimal hints.
The problem is everything around the Spring beans — third-party libraries, internal utility code that uses reflection, anything that was "working" on the JVM by relying on runtime class discovery. Every library upgrade changes reflection patterns. A minor version bump in Jackson might add new reflective access paths that you haven't registered. Budget time for metadata audits on every dependency upgrade — this is the hidden tax of native images.
Discovering Hints: The Tracing Agent
The GraalVM tracing agent is your primary tool for discovering what metadata your application needs:
# Attach the agent and run your app on the JVM
java -agentlib:native-image-agent=config-output-dir=src/main/resources/META-INF/native-image \
     -jar target/app.jar

# Exercise ALL code paths while the agent is recording
# Run your full integration test suite
# Hit every endpoint
# Execute error paths
# The agent records every reflective access, proxy creation, resource load
The critical limitation: the tracing agent only records paths that are actually executed. If you miss an endpoint in your test run, its reflection needs won't be captured. For production safety, follow this procedure:
- Run the agent against your full integration test suite
- Run the agent again against manual exploratory testing (have a person click through the UI)
- Merge the results using
native-image-agent=config-merge-dir=...to combine multiple runs - Audit the generated JSON files for completeness
- Before writing custom metadata, check the GraalVM Reachability Metadata Repository — it has pre-built hints for hundreds of libraries (Jackson, Hibernate, Netty, Spring, etc.). If your library is there, the hints are automatically applied during native compilation.
The Production Build Pipeline
Building a native image requires the GraalVM native-image compiler and a lot of memory. A simple local setup works, but for CI we recommend Docker-based builds to avoid installing GraalVM on every CI runner.
Here's a production-grade Gradle setup for Spring Boot 3.x:
plugins {
    id("org.springframework.boot") version "3.4.2"
    id("org.graalvm.buildtools.native") version "0.10.4"
    kotlin("jvm") version "2.1.0"
    kotlin("plugin.spring") version "2.1.0"
}

// No extra AOT dependency: applying the native plugin makes the Spring Boot
// plugin register processAot and add its output to the native binary.

graalvmNative {
    binaries {
        named("main") {
            imageName.set("order-service")

            // Tell the compiler to initialize these at build time
            // to avoid runtime overhead
            buildArgs.add("--initialize-at-build-time=org.slf4j")
            buildArgs.add("--initialize-at-build-time=ch.qos.logback")

            // Useful for debugging
            buildArgs.add("-H:+ReportExceptionStackTraces")

            // Enforce strict checks
            buildArgs.add("--strict-image-heap")
        }
    }

    // Enable GraalVM's community metadata repository
    // This pulls pre-written hints for hundreds of libraries
    metadataRepository {
        enabled.set(true)
    }
}
Build locally with ./gradlew nativeCompile (requires GraalVM JDK installed), or via Docker for CI:
# Docker build — no GraalVM install needed on CI runner
./gradlew bootBuildImage --imageName=order-service:native
Docker builds use Spring's Buildpacks infrastructure and download GraalVM internally. Budget minutes per service for the native-image build, not seconds. Not fast, but predictable and reproducible across environments. The build is deterministic — same input, same output every time — which is valuable for supply chain security.
Starting with 25.1 (first monthly release in June 2026), GraalVM moved to a monthly release train — explicitly to keep up with the AI-driven pace of development — while quarterly releases still fold in the latest JDK Critical Patch Update (reflected in the version's SECURITY digit, e.g. 25.1.3). The previous major (Oracle GraalVM 25.0) stays the stable train, receiving security and minor bug fixes. Practical impact: pin an explicit GraalVM version in your build image rather than tracking a floating tag, so a monthly bump never silently changes the compiler under a reproducible build.
For the final container, use a multi-stage Dockerfile to keep the image small:
# Stage 1: Build the native image
FROM ghcr.io/graalvm/native-image-community:21 AS builder

WORKDIR /app
COPY . .

# Build the native binary
# --no-daemon prevents gradle daemon from staying alive
# -x test skips tests during build (run them separately in CI)
RUN ./gradlew nativeCompile --no-daemon -x test

# Stage 2: Runtime image with just the binary
# Distroless images are tiny and have minimal attack surface
FROM gcr.io/distroless/base-debian12

WORKDIR /app

# Copy the native binary from builder
COPY --from=builder /app/build/native/nativeCompile/order-service /app/order-service

# No JVM, no package manager, no shell — just the binary
EXPOSE 8080
ENTRYPOINT ["/app/order-service"]
Image sizes across deployment strategies tell the story:
| Approach | Base Image | App Binary/JAR | Total Size |
|---|---|---|---|
| Fat JAR + JRE | Alpine + JRE (180MB) | 45MB | ~380MB |
| Jlink custom JRE | Distroless (20MB) | 80MB | ~145MB |
| Native + distroless | Distroless (20MB) | 48MB | ~68MB |
Consider a cluster pulling 1,000 pods of 380MB images — that's 380GB of bandwidth. The same pods as native images: 68GB — roughly five times smaller. This matters for deployment speed, node startup time, and bandwidth costs. The distroless base (no shell, no package manager) also reduces the attack surface for container security.
What a Stateless-Service Migration Typically Yields
For a stateless Spring Boot microservice moved to native image (REST + Kafka workers, no JPA), here's an illustrative composite before/after — not a measurement. Verify it against your own service:
| Metric | Before (JVM) | After (Native) | Improvement |
|---|---|---|---|
| Startup time | 4.2–11.3s | 48–120ms | ~90× faster (4.2s÷48ms ≈ 88; 11.3s÷120ms ≈ 94) |
| Memory RSS | 380–520MB | 85–140MB | ~73–78% reduction |
| Image size | 320–420MB | 55–95MB | ~77–83% reduction |
| Peak throughput | ~28k req/s (after warmup) | ~22k req/s (immediate) | ~20% lower |
K8s initialDelaySeconds | 15–30 | 1 | 15–30× faster readiness |
| HPA scale-up time | 2–3 min | <30 sec | 4–6× faster scaling |
The qualitative regression is real — AOT lacks the JIT's runtime profiling data, so peak throughput is typically lower[3] — even though the ~20% figure above is illustrative, derived from the table's own illustrative rows rather than a measured result. The calculation still flips for frequent scale-in/out workloads: JVM pods that scale out serve at reduced throughput until warm-up completes, so for short-lived pods a native image can serve more total requests per window.
Memory reduction from ~450MB to ~110MB RSS allows significantly more instances per node. Infrastructure cost drops. Rolling deployments compress from multi-minute windows to under 30 seconds.
The Production Gotchas
Dynamic Proxies: Internal libraries that generate dynamic proxies for service interfaces (similar to Spring AOP) completely break under native image because dynamic proxy generation at runtime is incompatible with the closed-world model — the compiler cannot know which interfaces will be proxied at build time. Solution: switch to compile-time proxy generation using an annotation processor. The work is painful but you only do it once.
Logback Configuration: Logback uses XML parsing and reflection to load configuration files. Your application compiles successfully but then crashes at runtime because Logback cannot find logback-spring.xml. Requires explicit hints via RuntimeHintsRegistrar to register resource patterns. This is one-time overhead if you get it right during the tracing agent phase.
Hibernate/JPA: The most blocking production issue. Services that use Spring Data JPA heavily require significant effort — expect weeks of work for complex entity graphs. Hibernate uses aggressive reflection to discover entity fields and bytecode enhancement for lazy loading. Requires spring.jpa.properties.hibernate.bytecode.provider=none and individual entity classes annotated with @RegisterReflectionForBinding or registered via hints. For services with complex JPA usage, honestly evaluate whether you need JPA at all. Switching to Spring JDBC (jOOQ, JDBI, or plain JdbcClient) makes native compilation dramatically simpler and faster.
Flyway Java Migrations: Flyway SQL migrations work fine with native image. But Flyway Java-based migrations (implementing BaseJavaMigration) need reflection hints for each migration class. If you have dozens of them, expect tedious annotation work. Conversion path: switch all future migrations to SQL, and add blanket hints for existing Java migrations via RuntimeHintsRegistrar.
When NOT to Use Native Images
Be honest about whether your service fits the native image profile. Forcing native images on services that don't benefit wastes time on metadata maintenance without the payoff.
Long-running batch processors (6+ hours) — A nightly ETL job that runs for 6 hours gets enormous benefit from JIT warm-up. Once warmed up, the JVM's JIT throughput can be higher than AOT's — the JIT profiles hot paths and optimizes on real execution data a static AOT compiler doesn't have[3]. A native image saves you 4 seconds of startup time. That's irrelevant for a 6-hour batch job. Stick with the JVM.
Heavy reflection frameworks — If your service deeply uses Hibernate with complex entity graphs and lazy loading, AspectJ load-time weaving for aspect application, or runtime bytecode generation via CGLIB or Javassist, the metadata maintenance burden will exceed any operational savings. Every library upgrade becomes a potential native build breakage. You'll find yourself writing reflection hints for code you didn't write and don't fully understand. For a small team, this overhead is unjustifiable.
Rapid development iteration — Native compilation can take many minutes locally (illustratively 8–15). During active development, this destroys your feedback loop. You make a change, rebuild (8 min), test (2 min), change again (8 min). Compare that to: change, ./gradlew bootRun (10 sec), test (2 min). In this example the JVM rebuild is ~50× faster (8 min ÷ 10 s = 48). Use JVM during development. Reserve native compilation for CI/staging/production only. Never run nativeCompile as part of your local dev cycle — configure your IDE to run JVM mode locally.
Plugin architectures — If your service loads code dynamically at runtime (OSGi, custom classloaders, Service Provider Interface with runtime discovery), native images fundamentally cannot support this pattern. The closed-world assumption is absolute. There's no configuration option to relax it. The entire model depends on knowing what code exists at build time. If code is discovered at runtime, native images will never work.
The trade-offs across all of these dimensions collapse into a single routing decision. Walk a candidate service through the flowchart below before committing engineering time to a migration — the wrong call here costs weeks of metadata work for negligible operational gain.
flowchart TD
    Start([New service candidate]) --> Plugin{Loads code dynamically<br/>at runtime?<br/>OSGi / custom classloaders / SPI}
    Plugin -->|Yes| StayJVM[Stay on JVM<br/>Closed-world incompatible]
    Plugin -->|No| Lifetime{Pod lifetime<br/>under 15 min?}

    Lifetime -->|No, runs hours/days| Batch{Batch / long-running<br/>throughput-critical?}
    Batch -->|Yes| StayJVM2[Stay on JVM<br/>JIT warm-up wins long-term]
    Batch -->|No, steady REST traffic| CDS[Consider CDS<br/>~1.5× faster startup, full JVM tooling]

    Lifetime -->|Yes, scales in/out| SLA{Strict startup SLA?<br/>K8s readiness less than 2s}
    SLA -->|No| CDS
    SLA -->|Yes| Reflection{Heavy reflection?<br/>complex JPA / AspectJ /<br/>runtime bytecode gen}

    Reflection -->|Yes, deep JPA graph| Refactor{Can refactor to<br/>JdbcClient / jOOQ?}
    Refactor -->|No| StayJVM3[Stay on JVM<br/>Metadata burden too high]
    Refactor -->|Yes| Native

    Reflection -->|No, mostly Spring beans| Native([Migrate to Native Image<br/>40-120ms startup, lower memory footprint])

    style Native fill:#22c55e,stroke:#16a34a,color:#fff
    style StayJVM fill:#ef4444,stroke:#dc2626,color:#fff
    style StayJVM2 fill:#ef4444,stroke:#dc2626,color:#fff
    style StayJVM3 fill:#ef4444,stroke:#dc2626,color:#fff
    style CDS fill:#f59e0b,stroke:#d97706,color:#fff
The two terminal cases on the right (Native Image, CDS) cover the common stateless Spring Boot shapes. The "stay on JVM" branches catch the rest — usually batch processors, JPA-heavy domain services, and anything with custom classloader logic inherited from older codebases.
Kubernetes Integration: Where Native Images Shine
The real payoff comes in Kubernetes. The combination of instant startup and low memory usage unlocks deployment patterns that are impossible with JVM images.
With instant startup, you can use aggressive probe timings that were previously unthinkable:
apiVersion: apps/v1
kind: Deployment
metadata:
  name: order-service
spec:
  replicas: 3
  template:
    spec:
      containers:
        - name: order-service
          image: registry.example.com/order-service:native
          resources:
            requests:
              memory: "128Mi"
              cpu: "100m"
            limits:
              memory: "256Mi"
              cpu: "500m"
          readinessProbe:
            httpGet:
              path: /actuator/health/readiness
              port: 8080
            # These timings are possible with native images
            # Were 15–30 seconds with JVM images
            initialDelaySeconds: 1
            periodSeconds: 2
            failureThreshold: 3
          livenessProbe:
            httpGet:
              path: /actuator/health/liveness
              port: 8080
            initialDelaySeconds: 2
            periodSeconds: 10
Memory requests are cut from 512Mi to 128Mi. The initialDelaySeconds on readiness probe goes from 15–30 to 1–2. This has cascading effects.
Impact on rolling deployments: With JVM images taking 15+ seconds to become ready, rolling deployments require a maintenance window. You have to coordinate: drain old pods, wait for new pods to warm up, then route traffic. With native images, rolling deployments can happen during business hours without performance impact. New pods are ready in 1 second. You can update all replicas in sequence without dropping requests.
Impact on HPA (Horizontal Pod Autoscaling): When a traffic spike triggers scale-up (e.g., 3 → 12 pods during a sale event), new pods must start serving traffic immediately or requests queue up. A JVM pod that needs to warm up is contributing capacity minutes after it's scheduled; a native pod that starts in milliseconds is serving almost immediately. For a latency-sensitive service under a spike, that warmup window is the difference between absorbing the load and dropping requests.
Impact on node consolidation: a lower per-pod memory footprint means more pods per node — directly fewer nodes for the same replica count, which is where the infrastructure cost reduction comes from. Quantify it with the instances_per_host = floor(host_memory / per_pod_RSS) math from the Go vs Java cost section, using your own measured native vs JVM RSS.
Production Debugging Without the JVM
The JVM ecosystem has decades of mature debugging tooling that does not exist in the native world. Before you migrate, understand the trade-offs:
| Tool | Purpose | Native Alternative |
|---|---|---|
jstack | Thread dumps | kill -3 <pid> (build with --enable-monitoring=threaddump) |
jmap / jcmd heap dump | Memory analysis | kill -USR1 <pid> or -XX:+HeapDumpOnOutOfMemoryError (build with --enable-monitoring=heapdump) |
| Arthas / BTrace | Live attach, method tracing | None |
| JFR | Production profiling | Partial support via --enable-monitoring=jfr |
| VisualVM / JMC | GUI profiling | Platform profilers (perf, async-profiler) |
You lose runtime attach, and heap dumps work only in binaries built with --enable-monitoring=heapdump[4]. This is a real limitation, not a footnote — plan for it before the first production incident, not during one. The standard mitigation: keep debug builds (with the -g flag) around for staging and production troubleshooting, and instrument aggressively with Micrometer so metrics cover what a live attach would otherwise have shown.
Mitigation strategy: instrument at the application level. Micrometer works identically in JVM and native mode. Set up alerts on these metrics, using the following as illustrative starting thresholds to tune per service:
jvm_memory_used_bytes{area="heap"}at 80% of max (native images have fixed max heap — no dynamic expansion)jvm_gc_pause_seconds_maxat 200ms (serial GC) or 50ms (G1 GC) — serial is stop-the-world; G1 has shorter pausesprocess_resident_memory_bytesat 80% of K8s memory limit (OOMKilled with no heap dump is painful to debug)http_server_requests_seconds{quantile="0.99"}set to your SLO — catches throughput regression vs JVM baseline
Thread and heap dumps only exist if the binary was built with them[5]:
graalvmNative {
    binaries {
        named("main") {
            buildArgs.add("-g") // Include debug symbols
            // SIGQUIT thread dumps, SIGUSR1 heap dumps, JFR. `threaddump` needs
            // GraalVM for JDK 22+; on JDK 21 use -H:+DumpThreadStacksOnSignal
            // with --enable-monitoring=heapdump,jfr instead.
            buildArgs.add("--enable-monitoring=threaddump,heapdump,jfr")
        }
    }
}
Then get a thread dump: kill -3 $(pgrep order-service) — the output goes to stderr.
For JFR (Java Flight Recorder), build with --enable-monitoring=jfr and start recording at runtime: ./order-service -XX:StartFlightRecording=filename=recording.jfr,duration=60s. JFR support in native images is partial — you get GC events, thread events, allocation tracking — but not class loading or JIT compilation events (those don't apply to AOT).
Production Patterns: What Works
Pattern 1: Spring Boot 3 Auto-Hints — Spring AOT auto-generates hints for @Component, @Service, @Entity, @ConfigurationProperties. Stick to Spring conventions; manual hints needed only for third-party DTOs and exotic reflection.
Pattern 2: Virtual Threads + Native Image — Virtual threads[6] work in native images. Use Executors.newVirtualThreadPerTaskExecutor() for both instant startup and high concurrency without thread pool exhaustion. Virtual threads reduce context-switch overhead on I/O-bound paths, which attacks the AOT throughput ceiling from the other direction.
Pattern 3: Separate Native Test Stage in CI — Run native tests in a separate gate, not on every commit. Fast feedback on JVM (5-10 sec), reserve native tests for pre-deployment checks. This tests the actual production binary without destroying dev iteration speed.
Migration Checklist
Budget 3–5 days per service for the first migration, 1–2 days with organizational knowledge.
Phase 1: Assessment
- Audit dependencies at GraalVM reachability metadata repo
- Identify reflection-heavy libs; evaluate replacements (JPA → JdbcClient, dynamic proxies → compile-time processor)
- Verify GraalVM JDK matches target Java version (17 or 21)
Phase 2: Build
- Add
org.graalvm.buildtools.nativeplugin; enable metadata repository - Run tracing agent against full integration test suite
- Achieve successful
nativeCompilelocally; write smoke test
Phase 3: Validate
- Run integration tests against native binary (
nativeTest) - Load test: compare throughput, latency (P50/P95/P99), memory vs JVM baseline
- Verify logging, actuator endpoints, graceful shutdown
Phase 4: Deploy
- Create multi-stage Dockerfile with distroless base
- Reduce K8s memory requests to match the RSS drop you measured (~73–78% in the illustrative table above); tighten probe timings
- Canary to staging, then production (e.g., 10% → 50% → 100%)
Production Checklist
- Reflection hints exhaustively documented
- Tracing agent run against full test suite + manual testing
- Native tests passing in CI
- K8s
initialDelaySecondsreduced to 1–2 - Memory requests reduced to match measured RSS drop (~73–78% in the illustrative table)
- Thread dump extraction documented (
kill -3 <pid>) - JFR recording setup verified
- Micrometer alerts configured for heap, GC, RSS
- Canary deployment plan written
Is It Worth It?
Native images shift costs: higher CI build time (native image builds take minutes rather than seconds — illustratively 8–15) in exchange for lower runtime memory and faster autoscaling. For a team running many services with several deployments per day, the extra CI compute is a real line item — weigh it against the node-consolidation savings above rather than assuming it nets out either way.
Use native images if you scale frequently (K8s HPA, serverless), need aggressive probe timings, or memory costs compound at scale. Skip them if you rely on heavy JPA, third-party reflection libraries, long-running batch jobs, or rapid dev iteration. The JVM is dramatically faster for local iteration — seconds versus minutes for a native rebuild.
For stateless microservices: memory reduction (~450MB → ~110MB RSS) allows consolidation onto fewer nodes, cutting infrastructure cost. Rolling deployments compress from multi-minute windows to under 30 seconds. The payoff compounds daily.
Picture an order service migrated to native image: the tracing agent runs against the full integration suite, nativeCompile succeeds, and the release ships. Everything passes — for a while. Two weeks in, a support ticket surfaces the failure: order-detail responses are missing lineItems, because the lazy-loaded @OneToMany relationship is silently returning empty lists instead of throwing.
The mechanism: the integration test fixtures use FetchType.EAGER, so the tracing agent never observes Hibernate's runtime proxy generation — that reflection path only exists under lazy loading, which the tests never exercise. In production, the lazy proxy class doesn't exist in the native image (closed-world assumption), so Hibernate falls back to an empty proxy instead of throwing. No error, no log, just missing data. Tracing it back to a reflection gap in a proxy class no test ever loaded takes days. The fix is to switch the critical queries to @EntityGraph and add every Hibernate proxy class to the reflection config by hand. The lesson: the tracing agent is only as good as your test coverage of runtime class loading paths, and "tests pass" is not "reflection hints are complete."
Frequently Asked Questions
What is the GraalVM closed-world assumption?
GraalVM native image performs static analysis at build time and includes only the code it can prove is reachable. Reflection, dynamic class loading, and JNI are not visible to static analysis, so they must be declared explicitly in configuration files or the code that uses them will fail at runtime.
How much faster is GraalVM native image startup vs JVM?
Native images start in milliseconds rather than seconds, per GraalVM's own documentation[1]; the illustrative ranges in this article are 40–120ms native vs 4–11s for a JVM Spring Boot service — measure your own. That suits Kubernetes environments with strict readiness probe SLAs and frequent autoscaling events.
Is GraalVM native image throughput lower than JVM?
Yes — native images typically show lower peak throughput than JVM JIT at steady state, because the AOT compiler lacks the runtime profiling data the JIT uses to optimize[3]. Profile-Guided Optimization (PGO), available in Oracle GraalVM but not Community Edition, narrows the gap by feeding profiles from a representative workload back into the AOT compiler. The size of the gap is workload-dependent — measure it on your own service.
When should I use GraalVM native image vs a regular JVM?
Use native images for services with short pod lifetimes (under 15 minutes), strict startup SLAs, or memory-constrained environments. Use the JVM for long-running services where peak throughput matters, services that rely heavily on reflection or dynamic class loading, or when build time (native image builds take minutes, not seconds — illustratively 8–15) is a constraint.
Keep Reading
- Spring Boot REST: JPA, Validation, Exception Handling, and Testing — The Spring Boot patterns that work seamlessly with native compilation
- Java Virtual Threads: Project Loom, Pinning Hazards, and Production Migration — Combine native images with virtual threads for instant startup and high concurrency
- Go vs Java in 2026: An Honest Performance Comparison for Backend Services — How GraalVM native images change the startup and memory comparison with Go
Coming Next
GraalVM is one way to achieve fast startup, but it is not the only path—nor is it always the right one. In our next deep dive, we outline alternative JVM startup optimization techniques, including AppCDS, CRaC, and tuning JIT flags, helping you choose the best route for your workloads. Read the JVM Fast Startup Decision Framework.
Sources
- 1.GraalVM Native Image Documentation — Oracle / GraalVM, 2026
- 2.Spring Boot CDS support and Project Leyden anticipation — spring.io, 2024
- 3.Profile-Guided Optimization — GraalVM Native Image Reference Manual — Oracle / GraalVM, 2026
- 4.Create a Heap Dump from a Native Executable — Oracle / GraalVM, 2026
- 5.GraalVM Native Image — Command-line Options — Oracle / GraalVM, 2026
- 6.JEP 444: Virtual Threads — OpenJDK, 2023
Engineering Team
An independent engineering publication covering distributed systems, databases, and production infrastructure. Every factual claim is cited to a primary source or removed.
Read Next
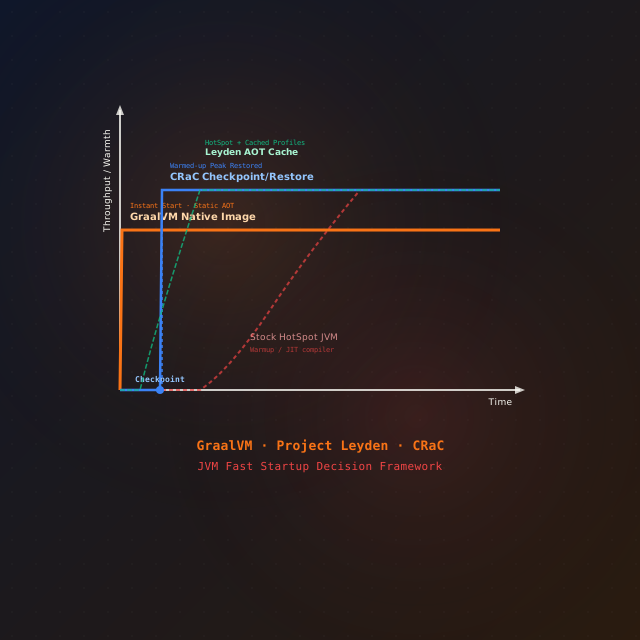
JVM Cold Start in 2026: Leyden vs GraalVM Native Image vs CRaC
Slow JVM cold start breaks scale-to-zero and autoscaling. Three ways to fix it in 2026 — Project Leyden's AOT cache, GraalVM Native Image, and CRaC — with the exact commands, the trade-offs, and a decision framework.

Java Virtual Threads: Project Loom, Pinning Hazards, and Production Migration
Java 21 virtual threads: M:N scheduling, pinning hazards, ThreadLocal pitfalls, JFR detection, and what migration really takes.

Go vs Java in 2026: An Honest Performance Comparison for Backend Services
An honest Go (Gin) vs. Java (Spring Boot) comparison for backend services in 2026: memory behavior, cold starts, GC pauses, and cost math — built on documented runtime behavior plus a copy-paste benchmark harness, not unverifiable numbers.