SRE Guide to SLOs, SLIs, and Error Budgets: A Production Playbook

Lesson 4 of 4
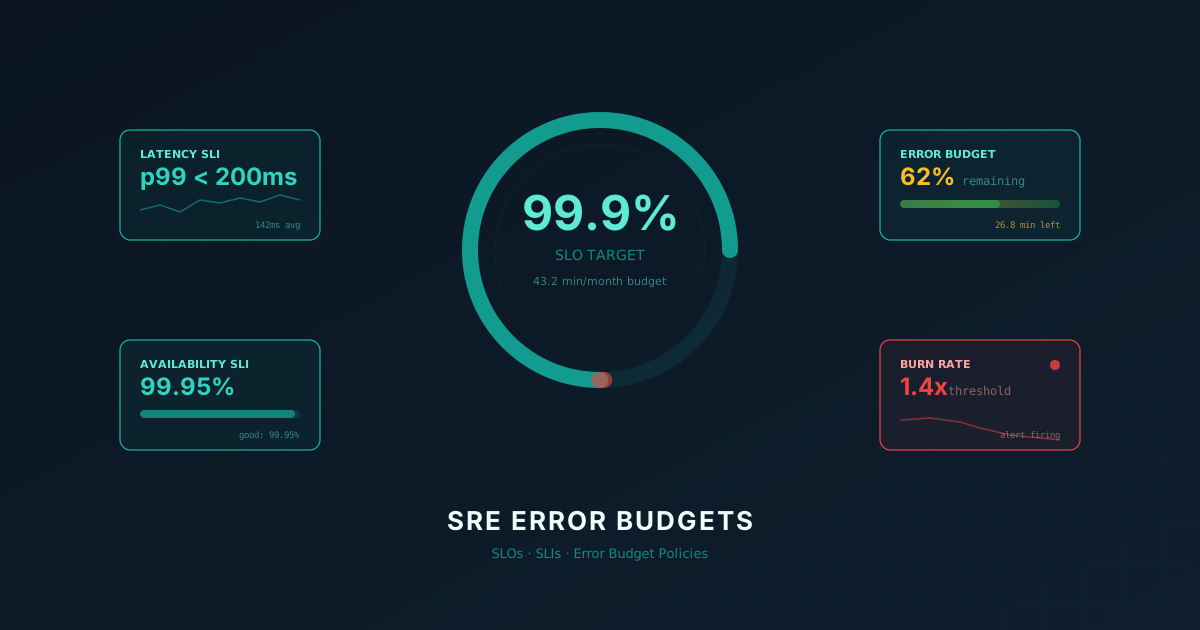
An SLI is what users experience, an SLO is the target you set for it, and an error budget is the room you have to miss that target. A 99.9% SLO, for example, leaves a 0.1% error budget — 43.2 minutes of allowed downtime a month. That's the entire mechanism: an error budget converts "we should focus on reliability" from an engineering opinion into an organizational fact — when the budget is gone, the data halts risky deploys, not the loudest VP. The framework is Google SRE's[1]; this page is the working version: the nines math, the Prometheus SLI instrumentation, a real SLO policy doc, and paste-ready multi-window burn-rate alerts.
- SLI = what users experience (requests succeeded, under 200ms latency, data correct)
- SLO = the target for that SLI (99.9% of requests succeed over 30 days)[1]
- Error budget = the inverse of the SLO — what's left to spend on incidents and risky deploys
- Burn rate = how fast you're consuming that budget; a 14.4× burn rate exhausts a 30-day budget in about 50 hours (720 h ÷ 14.4), the SRE Workbook's recommended page threshold[2]
The nines table — what each SLO actually allows
Standard availability math over a 30-day window (exact arithmetic, no estimates): 30 days = 43,200 minutes, so allowed downtime = (1 − SLO) × 43,200 — e.g. for 99.9%, 0.001 × 43,200 = 43.2 minutes.
| SLO | Error budget | Downtime allowed / 30 days | Typical tier |
|---|---|---|---|
| 99% | 1% | 7.2 hours | internal tooling |
| 99.5% | 0.5% | 3.6 hours | recommendations, analytics |
| 99.9% | 0.1% | 43.2 minutes | feed, search, most APIs |
| 99.95% | 0.05% | 21.6 minutes | checkout, payments |
| 99.99% | 0.01% | 4.32 minutes | auth, infrastructure core |
Two rules before picking a row: your SLO must sit below an SLA you've signed (the SLO is the internal alarm that fires before the contractual penalty), and if your system already runs at exactly your SLO, the SLO is meaningless — set it from user tolerance, then tighten after a quarter of data[1].
The quick start: SLIs, SLOs, and error budgets
The relationship between SLI, SLO, and error budget in one picture — measure → target → spend:
graph TD
    Users[Users send requests] --> Service[Service handles them]
    Service -->|measure user experience| SLI[SLI<br/>Service Level Indicator<br/>e.g. p99 latency, success rate]
    SLI -->|compare to target| SLO[SLO<br/>Service Level Objective<br/>e.g. 99.9% under 200 ms]
    SLO -->|inverse| Budget[Error Budget<br/>0.1% = 43 min/month<br/>downtime allowance]
    Budget -->|spent on| Risk[Risky deploys<br/>infra changes<br/>incidents]
    Budget -.->|burn rate alert<br/>14.4x = page immediately| Page[On-call page]
    Risk -->|drains| Budget
    Page --> Triage[Triage + halt<br/>risky deploys]
    style SLI fill:#dfd
    style SLO fill:#ffd
    style Budget fill:#ffd
    style Page fill:#fdd
The SLI/SLO/Error Budget terminology in this section follows Google's SRE Book[1]. The minute-level downtime conversions come from the standard "nines" math (e.g. 99.9% over 30 days = 43.2 minutes of allowed downtime).
| Concept [1] | What it measures | Example |
|---|---|---|
| SLI (Service Level Indicator) | Quantitative metric users experience — success rate, latency, quality. Not CPU, not memory. | "94% of requests completed under 200ms this hour" |
| SLO (Service Level Objective) | Internal reliability target over a time window (usually 30 days). | "95% of requests must complete under 200ms" |
| Error Budget | The failure allowance: the inverse of your SLO. A 99.9% SLO = 0.1% error budget = 43 minutes of downtime per month. | "Our 99.9% SLO gives us 43 min/month to spend on incidents or risky deploys." |
| Burn Rate | How fast you're consuming your error budget relative to sustainable speed (1.0× = on-track for month-end). | "A 14.4× burn rate exhausts a 30-day budget in ~50 hours. Page immediately."[2] |
Map the nines table's tiers onto your own service criticality — they're conventions, not prescriptions; the downtime arithmetic is the exact part.
Step 1: Instrument your service with SLI metrics
Wrap your HTTP router with a middleware that captures what users experience: server errors (5xx — 4xx are the client's), latency, and totals. Record these as Prometheus counters and histograms.[3]
package sli

import (
    "net/http"
    "strconv"
    "time"
    "github.com/prometheus/client_golang/prometheus"
    "github.com/prometheus/client_golang/prometheus/promauto"
)

var (
    requestsTotal = promauto.NewCounterVec(
        prometheus.CounterOpts{
            Name: "http_requests_total",
            Help: "Total HTTP requests by status class",
        },
        []string{"service", "method", "status_class"},
    )

    requestDuration = promauto.NewHistogramVec(
        prometheus.HistogramOpts{
            Name: "http_request_duration_seconds",
            Help: "HTTP request latency in seconds",
            // Critical: include your SLO threshold (e.g., 0.2s) as an explicit bucket.
            // histogram_quantile() can only interpolate within bucket boundaries.
            Buckets: []float64{0.01, 0.05, 0.1, 0.2, 0.5, 1.0, 2.5, 5.0},
        },
        []string{"service", "method"},
    )
)

// Middleware for HTTP router
func SLIMiddleware(service string, next http.Handler) http.Handler {
    return http.HandlerFunc(func(w http.ResponseWriter, r *http.Request) {
        start := time.Now()
        rec := &statusRecorder{ResponseWriter: w, status: http.StatusOK}
        next.ServeHTTP(rec, r)

        duration := time.Since(start).Seconds()
        statusClass := strconv.Itoa(rec.status/100) + "xx"

        requestsTotal.WithLabelValues(service, r.Method, statusClass).Inc()
        requestDuration.WithLabelValues(service, r.Method).Observe(duration)
    })
}

type statusRecorder struct {
    http.ResponseWriter
    status int
}

func (r *statusRecorder) WriteHeader(code int) {
    r.status = code
    r.ResponseWriter.WriteHeader(code)
}
Then compute your SLIs directly from these metrics in PromQL:
# Availability: % of requests that did not fail server-side (non-5xx)
1 - sum(rate(http_requests_total{service="checkout", status_class="5xx"}[30d]))
    / sum(rate(http_requests_total{service="checkout"}[30d]))

# Latency: % of requests under 200ms threshold
sum(rate(http_request_duration_seconds_bucket{service="checkout", le="0.2"}[30d]))
/ sum(rate(http_request_duration_seconds_count{service="checkout"}[30d]))
Key rule: Your histogram buckets must include your SLO threshold as an explicit boundary. Without le="0.2" as a bucket, Prometheus interpolation makes latency measurement imprecise. See The 3 Pillars of Observability for the full metrics + logging + traces stack.
Step 2: Define SLO targets and error budget policy
Write down your SLO and the actions that follow when budget is spent. Without a written policy, reliability discussions default to hierarchy and shouting.
A 99.95% SLO (checkout, payments in the table above) gives you 21.6 minutes of monthly error budget; a 99.9% SLO (feed, search) gives you 43 minutes. Choose based on user impact, not on what your current system achieves[1].
The SLO Document — one page, signed off by engineering and product leadership:
### Checkout Service SLO — Q1 2026

### SLO Targets (30-day rolling window)

- Availability: 99.95% → 21.6 min/month error budget
- Latency: 95% of requests < 200ms → 5% slow budget
- Quality: 99.9% error-free responses

### Error Budget Policy

- > 75% remaining: Normal deployment velocity
- 50–75%: Cautious deploys; staging validation required
- 25–50%: Reliability focus; defer risky changes
- < 25%: Feature freeze; reliability work only
- 0%: Emergency fixes only; VP Engineering notified

### Review Cadence

Monthly SLO review. Quarterly target adjustment.
Store this in your wiki or runbook. The value of writing it down is that it removes politics: when a product manager asks "why can't we ship feature X?", the answer is a concrete one, not an opinion — for example, "the error budget is at 18% today, and the policy above blocks non-critical deploys below 25%." Agreed in advance, enforced by data, not opinions.
Step 3: Multi-window burn-rate alerting
A single-threshold alert ("alert when error rate > 1% for 5 min") fires too often or too late. A 5-minute spike from a transient failure looks identical to the start of a real incident.[1]
Burn rate = (current error rate) / (tolerable error rate). For a 99.9% SLO, tolerable error rate = 0.1%. If you're actually erroring at 1.4%, burn rate = 1.4 / 0.1 = 14×. The Google SRE Workbook recommends paging at 14.4× over a 1-hour window (2% of the 30-day budget gone; at that rate it lasts ~50 hours) and at 6× over 6 hours (5%), and opening a ticket at 1× over 3 days (10%)[2].
Multi-window alerting requires both a long window (enough budget burned to matter) and a short window 1/12 its length (still burning right now) — 1h with 5m, 6h with 30m[2]. The long window filters out brief spikes; the short one makes the alert stop firing minutes after the errors stop instead of an hour later.
graph TD
    ErrRate["Current error rate"] --> Burn["burn rate<br/>= error rate / SLO threshold"]
    Burn --> Short{"Short window<br/>(5m) burn ≥ 14.4×?"}
    Burn --> Long{"Long window<br/>(1h) burn ≥ 14.4×?"}
    Short -->|yes| AndGate{"AND"}
    Long -->|yes| AndGate
    AndGate -->|both| Page["PAGE<br/>(budget dies in ~50h)"]
    Short -->|yes, long=no| Ignore["suppress<br/>(transient spike)"]
    Long -->|yes, short=no| Reset["stop firing<br/>(errors already stopped)"]
The AND gate is what turns raw burn-rate into actionable paging. A lone 5-minute window fires on every blip; a lone 1-hour window keeps paging for up to an hour after recovery. Requiring both confirms the incident is real and still hot.
groups:
  - name: error_budget_burn
    rules:
      # PAGE: 14.4× burn over 1h, confirmed by the 5m short window
      - alert: ErrorBudgetBurnCritical
        expr: |
          (sum(rate(http_requests_total{service="checkout", status_class="5xx"}[1h]))
               / sum(rate(http_requests_total{service="checkout"}[1h])))
          / (1 - 0.9995) > 14.4
          AND
          (sum(rate(http_requests_total{service="checkout", status_class="5xx"}[5m]))
               / sum(rate(http_requests_total{service="checkout"}[5m])))
          / (1 - 0.9995) > 14.4
        labels:
          severity: critical
        annotations:
          summary: "Error budget burning at 14.4× sustainable rate (50 hr to exhaustion)"

      # PAGE: 6× burn over 6h, confirmed by the 30m short window
      - alert: ErrorBudgetBurnHigh
        expr: |
          (sum(rate(http_requests_total{service="checkout", status_class="5xx"}[6h]))
               / sum(rate(http_requests_total{service="checkout"}[6h])))
          / (1 - 0.9995) > 6
          AND
          (sum(rate(http_requests_total{service="checkout", status_class="5xx"}[30m]))
               / sum(rate(http_requests_total{service="checkout"}[30m])))
          / (1 - 0.9995) > 6
        labels:
          severity: critical
        annotations:
          summary: "Error budget burning at 6× rate (~5 days to exhaustion)"
Add these queries to your Grafana dashboard for real-time visibility:
# Error budget remaining (0 to 1)
1 - ((sum(rate(http_requests_total{service="checkout", status_class="5xx"}[30d]))
           / sum(rate(http_requests_total{service="checkout"}[30d])))
     / (1 - 0.9995))

# Hours until the remaining budget is exhausted at the current 6h error rate
clamp_min(1 - (sum(rate(http_requests_total{service="checkout", status_class="5xx"}[30d]))
               / sum(rate(http_requests_total{service="checkout"}[30d])))
              / (1 - 0.9995), 0)
* (1 - 0.9995) * 30 * 24
/ clamp_min(sum(rate(http_requests_total{service="checkout", status_class="5xx"}[6h]))
/ sum(rate(http_requests_total{service="checkout"}[6h])), 0.000001)Step 4: Error budgets in practice
The mechanism that makes this work: when the error budget hits a critical threshold — for example, 22% remaining with a high burn rate — the policy triggers automatically, freezing features until the budget recovers. The features ship next quarter instead. The reliability payoff is that the team is forced toward reliability work exactly when the signals say it's needed, rather than shipping under pressure and compounding the problem.
Without error budgets, that conversation is a negotiation between engineers (who feel the pain) and product managers (who feel shipping pressure). With error budgets, the policy makes the decision weeks before the pressure arrives. Build the framework before you need it.
Common error budget policies in practice:
- Quarterly budget reviews: Services consistently consuming
<30%of budget get tighter SLOs in the next quarter (cost-benefit trade-off). - Deployment gating: Pipeline checks error budget before releasing. Once the budget is exhausted, releases halt except P0 and security fixes until the service is back within its SLO — the SRE Workbook's example policy[4]. An earlier warning gate (e.g., < 25% remaining) is a local choice, not part of that policy.
- Post-mortem budget tracking: Incident post-mortems include a "budget impact" section. A 2% budget burn from a partial outage is triaged differently than a 15% burn from a complete outage of the same duration.
Production checklist
- Instrumentation: Wrap HTTP router with
SLIMiddleware. Verifyhttp_requests_totalandhttp_request_duration_secondsappear in Prometheus with correct labels. - SLO definition: Write SLO document with error budget policy. Get sign-off from engineering lead and product manager.
- Histogram buckets: Include your latency SLO threshold (e.g., 0.2s) as an explicit bucket boundary. Without it, PromQL measurement is imprecise.
- Alerting rules: Deploy multi-window burn-rate alerts (page: 14.4× over 1h+5m and 6× over 6h+30m; ticket: 1× over 3d+6h). Test PagerDuty integration.
- Dashboards: Add "error budget remaining" and "hours to exhaustion" queries to main SRE dashboard.
- Monitoring: Track actual vs. predicted budget consumption monthly. Adjust SLO targets quarterly based on performance data.
Multi-window burn-rate alerts you can paste directly
The policy from Google's SRE Workbook — page on fast burn (14.4× over 1h, which would deplete the monthly budget in ~2 days) and medium burn (6× over 6h, ~5 days), ticket on slow burn (1× over 3 days)[2]. Each long window is paired with a short window 1/12 its length so alerts clear soon after recovery:
# alerts/slo.yml — 99.95% availability SLO (checkout) over a 30-day window
groups:
  - name: slo.checkout.availability
    interval: 30s
    rules:
      - record: slo:sli_error:ratio_rate5m
        expr: |
          sum(rate(http_requests_total{service="checkout",status_class="5xx"}[5m]))
          / sum(rate(http_requests_total{service="checkout"}[5m]))

      - record: slo:sli_error:ratio_rate30m
        expr: |
          sum(rate(http_requests_total{service="checkout",status_class="5xx"}[30m]))
          / sum(rate(http_requests_total{service="checkout"}[30m]))

      - record: slo:sli_error:ratio_rate1h
        expr: |
          sum(rate(http_requests_total{service="checkout",status_class="5xx"}[1h]))
          / sum(rate(http_requests_total{service="checkout"}[1h]))

      - record: slo:sli_error:ratio_rate6h
        expr: |
          sum(rate(http_requests_total{service="checkout",status_class="5xx"}[6h]))
          / sum(rate(http_requests_total{service="checkout"}[6h]))

      - record: slo:sli_error:ratio_rate3d
        expr: |
          sum(rate(http_requests_total{service="checkout",status_class="5xx"}[3d]))
          / sum(rate(http_requests_total{service="checkout"}[3d]))

      - alert: ErrorBudgetBurnFast
        expr: |
          slo:sli_error:ratio_rate1h > (14.4 * 0.0005)
          and
          slo:sli_error:ratio_rate5m > (14.4 * 0.0005)
        labels: { severity: critical, team: checkout }
        annotations:
          summary: "Checkout burning 14.4× SLO budget — page now"
          description: "2% of the 30-day budget gone in 1h; at this rate it exhausts in ~2 days."

      - alert: ErrorBudgetBurnMedium
        expr: |
          slo:sli_error:ratio_rate6h > (6 * 0.0005)
          and
          slo:sli_error:ratio_rate30m > (6 * 0.0005)
        labels: { severity: critical, team: checkout }
        annotations:
          summary: "Checkout burning 6× SLO budget — page"
          description: "5% of the 30-day budget gone in 6h; at this rate it exhausts in ~5 days."

      - alert: ErrorBudgetBurnSlow
        expr: |
          slo:sli_error:ratio_rate3d > (1 * 0.0005)
          and
          slo:sli_error:ratio_rate6h > (1 * 0.0005)
        labels: { severity: warning, team: checkout }
        annotations:
          summary: "Checkout burning 1× SLO budget — open a ticket"
          description: "10% of the 30-day budget gone in 3d; sustained low-grade errors."
The query that powers your "budget remaining" dashboard tile — emits the percentage of the 30-day budget still available, so the on-call sees 73% remaining (4d 18h ahead of forecast) instead of guessing from raw error rates:
# slo_error_budget_remaining_ratio — paste as a recording rule for caching
1 - (
  sum(increase(http_requests_total{service="checkout",status_class="5xx"}[30d]))
  /
  (
    sum(increase(http_requests_total{service="checkout"}[30d]))
    * 0.0005   # the 0.05% allowed-error fraction = (1 - 0.9995)
  )
)
The 0.0005 is the only knob — change it to match your SLO target (0.001 for 99.9%, 0.0001 for 99.99%). Everything else stays[1].
Pair it with a Slack notification webhook so engineers see the budget tile drift before the page fires:
# alertmanager.yml — pages go to PagerDuty; the warning-tier ErrorBudgetBurnSlow goes to Slack
route:
  receiver: checkout-pager
  routes:
    - matchers: ['severity="warning"']
      receiver: checkout-slack
receivers:
  - name: checkout-pager
    pagerduty_configs:
      - routing_key_file: /etc/alertmanager/secrets/pagerduty-routing-key
  - name: checkout-slack
    slack_configs:
      # Alertmanager does not expand env vars; mount the webhook URL as a file
      - api_url_file: /etc/alertmanager/secrets/slack-webhook-url
        channel: '#oncall-checkout'
        title: '{{ .CommonLabels.alertname }} — {{ .CommonLabels.severity }}'
        text: |
          {{ range .Alerts }}
          *Summary:* {{ .Annotations.summary }}
          *Burn rate:* {{ .Annotations.description }}
          *Runbook:* https://runbooks.example/slo-burn
          {{ end }}
        send_resolved: true
A simple budget-remaining query you can run ad-hoc (e.g., from promtool query instant) when an executive asks "how close are we to violating the SLO this month?":
promtool query instant http://prometheus:9090 \
  'slo_error_budget_remaining_ratio * 100'
# Expected: 73.4 (73.4% of the 30-day budget still available)
User-journey SLOs vs API-endpoint SLOs
Per-endpoint SLOs lie about user experience. A checkout flow that calls product-service, cart-service, payment-service, and order-service can have every endpoint at 99.95% availability and still drop one in five hundred customers — because each microservice failure compounds along the journey. The user does not care that POST /payments/charge met its SLO. The user cares that the journey from "Add to cart" to "Order confirmed" worked end-to-end[1].
Composite SLOs measure what users actually experience. A checkout journey SLO instruments the user-facing funnel — typically with a journey-id attached at the gateway and propagated through every hop — and counts a journey successful only when every step in the chain succeeds within the latency budget. The math is unforgiving: four 99.95% services chained sequentially produce a journey availability of 0.9995^4 = 99.80%, which equals 86 minutes of monthly downtime instead of the 21.6 minutes each individual service promises[1].
The instrumentation pattern is a journey counter recorded at the terminal step, with a label for the failed stage when the journey fails. This lets you keep one SLO for the whole flow and still answer "where are journeys dying?" without joining four endpoint metrics:
// Emit one metric per completed journey, labelled by terminal status and failed stage.
var journeyOutcomes = promauto.NewCounterVec(
    prometheus.CounterOpts{
        Name: "checkout_journey_outcomes_total",
        Help: "Checkout journeys by terminal status and failed stage",
    },
    // failed_stage = "" on success; "cart" | "payment" | "fulfilment" | ... on failure
    []string{"outcome", "failed_stage"},
)

func RecordJourney(ctx context.Context, j Journey) {
    if j.Err == nil && j.Duration <= 4*time.Second {
        journeyOutcomes.WithLabelValues("success", "").Inc()
        return
    }
    stage := j.FailedStage // populated by the step that returned the error
    if stage == "" && j.Duration > 4*time.Second {
        stage = "latency"
    }
    journeyOutcomes.WithLabelValues("failure", stage).Inc()
}
The recording rule then computes both the headline journey SLI and a per-stage attribution view that points the on-call at the right service without dashboard hunting:
# Headline: journey-level success rate over 30 days (the SLO that matters)
sum(rate(checkout_journey_outcomes_total{outcome="success"}[30d]))
/ sum(rate(checkout_journey_outcomes_total[30d]))

# Attribution: which stage is consuming the most journey error budget right now?
topk(3,
  sum by (failed_stage) (
    rate(checkout_journey_outcomes_total{outcome="failure", failed_stage!=""}[6h])
  )
)
The attribution query is where this pays off operationally. When a journey-level burn-rate alert fires and the first dashboard tile shows that, for example, 73% of failures in the last six hours are tagged failed_stage="payment", the on-call pages the payments team directly instead of opening four runbooks. Without the journey label, you would see only "checkout availability dropped" and spend the first twenty minutes correlating endpoint dashboards by hand — exactly when minutes are most expensive.
Two non-obvious rules from running journey SLOs in production:
- Set the journey latency budget at the user-perceived boundary, not the sum of per-service p99s. If product expects checkout to feel snappy under 4 seconds end-to-end, that 4 seconds is the SLO — even if the four downstream services budget for 1.5 seconds each and "fit" on paper. Tail amplification (a 1% slow rate at each of four services compounds to ~3.9% slow journeys) means the per-service math always understates the journey p99[5].
- Do not double-count budget. Keep per-service SLOs as health signals that page the owning team, but only the journey SLO gates the deployment policy. Otherwise a payments deploy gets blocked because cart-service burned its independent budget on an unrelated incident, which trains teams to ignore the policy.
The endpoint SLOs still earn their keep — they tell the cart team their service is fine when checkout is failing — but the journey SLO is what product, on-call, and the error-budget policy meeting all reference. Build it the moment you have more than two services in a critical user flow.
Frequently Asked Questions
What is an error budget and how is it calculated?
An error budget is the inverse of your SLO target — the amount of unreliability you can tolerate. A 99.9% SLO gives you a 0.1% error budget, which translates to about 43 minutes of allowed downtime per month[1]. When the budget is exhausted, the policy dictates halting risky deployments until it recovers.
What is the difference between an SLO and an SLA?
An SLO (Service Level Objective) is an internal reliability target your team sets and monitors. An SLA (Service Level Agreement) is an external contractual commitment with financial penalties for violations. SLOs should always be stricter than SLAs to provide a safety margin.
What is multi-window burn rate alerting?
Multi-window burn rate alerting (from the Google SRE Workbook) triggers alerts based on how fast you are consuming your error budget relative to the budget period. It uses multiple time windows (e.g., 1-hour and 6-hour) to distinguish sustained burns from brief spikes, reducing alert noise while catching real incidents.
How do you choose the right SLO target for a service?
Base your SLO on user expectations and business impact, not on what your system currently achieves. Start with a slightly lower target than current performance, measure for a quarter, then tighten. Four nines (99.99%) means only 4 minutes of monthly downtime — most services should start at 99.5-99.9%[1].
Keep Reading
- The 3 Pillars of Observability — Prometheus metrics, structured logging, and OpenTelemetry traces that feed the SLIs your error budgets depend on
- Terraform in Production — Modules, state management, and CI/CD pipelines for the infrastructure that backs your SLO targets
- Building Resilient Distributed Systems with Go — Circuit breakers, bulkheads, and retry policies that protect your error budget from cascading failures
- Linux Commands Cheat Sheet — When the burn-rate alert fires, the next layer of triage is SSH into the box: ss, lsof, journalctl, top
- Distributed Rate Limiting (Probabilistic Drop) — Shed load before it burns the error budget; drop_ratio converges global RPS to the SLO without per-request coordination
Sources
- 1.Site Reliability Engineering: How Google Runs Production Systems — O'Reilly / Google, 2016
- 2.The Site Reliability Workbook — Chapter 5: Alerting on SLOs — Google / O'Reilly (free online edition at sre.google), 2018
- 3.Prometheus — Histograms, Summaries, and Labels Best Practices — Prometheus Project, 2026
- 4.The Site Reliability Workbook — Example Error Budget Policy — Google / O'Reilly (free online edition at sre.google), 2018
- 5.The Tail at Scale — Communications of the ACM, 2013
Engineering Team
An independent engineering publication covering distributed systems, databases, and production infrastructure. Every factual claim is cited to a primary source or removed.
Read Next
The 3 Pillars of Observability: Metrics, Logs, and Traces in Production
Master observability with real code: Prometheus metrics, structured logging with slog, and OpenTelemetry tracing to debug incidents fast.

Terraform in Production: Modules, State Management, and CI/CD Patterns
Terraform in production: state locking, module design, environment directories, and CI/CD guardrails that prevent resource destruction.

Essential Kubernetes Commands: The Complete kubectl Cheat Sheet
Definitive kubectl reference: pod debugging, deployments, StatefulSets, RBAC, scheduling, Helm, and production troubleshooting flowcharts.