The 3 Pillars of Observability: Metrics, Logs, and Traces in Production

Lesson 3 of 4
Peak traffic. Every dashboard green. Every support phone ringing. Error rate steady, p50 fast, four-nines uptime — yet metrics count only HTTP 500s, traces sample 10 percent and exclude errors, logs sample 50 percent. Every pillar correct in isolation, every pillar blind in the same way.
When All Three Pillars Fail Together
Dashboards green (low single-digit error rate, fast p50, four-nines uptime), customer support phones lighting up — this is the peak-traffic incident observability exists to catch. It's a recognizable shape, not a specific event:
-
Metrics blind spot: The error rate metric counts only HTTP 500s. Actual failures are HTTP 200s with
{"status": "declined"}in the body — application-level failures invisible to infrastructure monitoring. -
Traces blind spot: Distributed traces sampled at 10%, and the sample filtered for
duration > 5s AND status = success. Payment gateway timeouts eventually return errors, so they never appear in the "slow traces" view. -
Logs blind spot: Logs sampled at 50% per endpoint. Half the payment decline logs never make it to disk.
The gateway is rejecting connections under peak load. Three pillars. Three failures. The rest of this article is about preventing that.
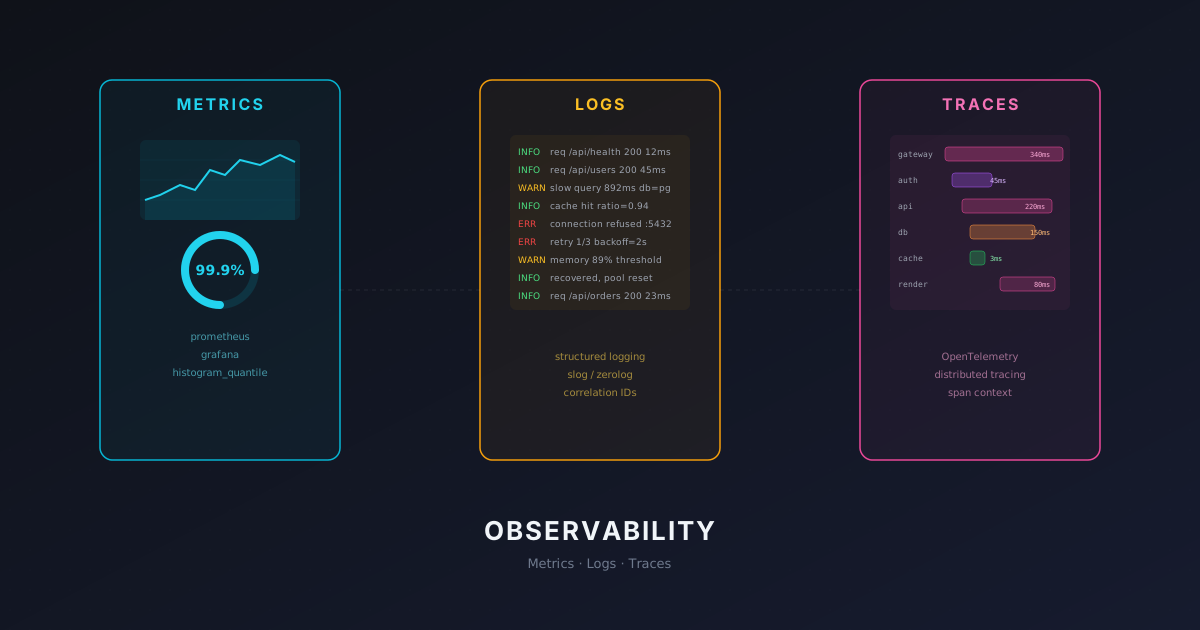
Observability requires correlating metrics (what broke), logs (why), and traces (where). But tools alone don't prevent incidents — you must instrument at service boundaries, never sample errors, and route from metrics → traces → logs with trace ID correlation. Tail-based sampling can keep 100% of error traces and slow requests[1] while storing only a small sample of healthy ones.
- Instrument HTTP handlers with Prometheus histograms[2]; use labels for cardinality control, not raw paths
- Structure logs as JSON with trace_id propagation; sample INFO at 10-50%, never sample WARN/ERROR
- Use OpenTelemetry for traces; tail-sample errors and latency > 1s, 1-5% of successes
Triage Flow: Metrics → Traces → Logs
Each pillar answers a different question and costs different amounts. The discipline during an incident is: never start at logs, never alert on traces, never explain "why" with metrics. Route by what you need:
graph TD
    Page[Pager fires] --> M[Metrics<br/>Prometheus, Grafana]
    M -->|What broke?<br/>error rate spike,<br/>latency p99 climb| MetricFound[Identify the SLO<br/>that is breaching]
    MetricFound -->|Need: where<br/>in the request path?| T[Traces<br/>OpenTelemetry, Tempo]
    T -->|Drill into the<br/>slow or failing span| TraceFound[Identify the<br/>service or DB call]
    TraceFound -->|Need: why<br/>exactly?| L[Logs<br/>structured JSON,<br/>trace_id-correlated]
    L -->|Filter by trace_id| Root[Root cause<br/>specific error message]
    Root -.->|Fix or page<br/>the right team| Resolve[Resolve incident]
    style M fill:#dfd
    style T fill:#ffd
    style L fill:#fdd
    style Root fill:#dfd
The diagram is the entire on-call discipline in one picture: metrics alert (cheap, always-on), traces locate (sampled but always keep errors), logs explain (most expensive — only correlated by trace_id).
The Quick Start: Which Pillar For What
Each pillar answers a different question and costs different amounts. Use them in sequence during incidents:
| Signal | Question | Cost driver | Use case |
|---|---|---|---|
| Metrics | What broke? | Active series (label cardinality) | Alert on error rate, latency spikes. First signal to fire. |
| Traces | Where in the request path? | Spans kept (sampling rate) | Identify which service/database call is slow or failing. |
| Logs | Why exactly? | Bytes ingested (log volume; sample carefully) | Get the specific error message and context. |
In the opening scenario the handoff runs: metrics fire (decline rate up) → traces show gateway.charge hitting its timeout → logs show connection refused on one gateway IP.
Metrics: Alert on RED (Rate, Errors, Duration)
Prometheus histograms give you percentile latencies and error rates[2]. Instrument at HTTP handler boundaries, not inside business logic. The critical rule: use router-normalized paths for labels, never raw paths.
package metrics

import (
	"net/http"
	"strconv"
	"time"

	"github.com/prometheus/client_golang/prometheus"
	"github.com/prometheus/client_golang/prometheus/promauto"
)

var httpDuration = promauto.NewHistogramVec(
	prometheus.HistogramOpts{
		Name:    "http_request_duration_seconds",
		Buckets: []float64{0.005, 0.01, 0.05, 0.1, 0.2, 0.5, 1.0, 2.5}, // 0.2 = the 200ms SLO threshold
	},
	[]string{"method", "endpoint", "status"},
)

// InstrumentedHandler: instrument at the boundary
func InstrumentedHandler(pattern string, next http.Handler) http.Handler {
	return http.HandlerFunc(func(w http.ResponseWriter, r *http.Request) {
		start := time.Now()
		rw := &responseWriter{ResponseWriter: w, statusCode: 200}
		next.ServeHTTP(rw, r)

		duration := time.Since(start).Seconds()
		status := strconv.Itoa(rw.statusCode)
		// Use router pattern (/users/{id}), NOT raw path (/users/123)
		httpDuration.WithLabelValues(r.Method, pattern, status).Observe(duration)
	})
}

type responseWriter struct {
	http.ResponseWriter
	statusCode int
}

func (rw *responseWriter) WriteHeader(code int) {
	rw.statusCode = code
	rw.ResponseWriter.WriteHeader(code)
}
Keep the SLO threshold as an explicit bucket: a classic-histogram ratio query on le="0.2" returns no result at all if no bucket has that boundary[2].
Key rule: Never use unbounded label values (like raw user IDs or request paths). Each unique combination becomes a separate time series[3]. At 10K requests/second with high cardinality, you OOM Prometheus. Use router patterns instead: /users/{id} not /users/123, /users/456, etc.
# p99 latency per endpoint, then 5xx error rate — both from the histogram above
histogram_quantile(0.99, sum(rate(http_request_duration_seconds_bucket[5m])) by (endpoint, le))
sum(rate(http_request_duration_seconds_count{status=~"5.."}[5m])) / sum(rate(http_request_duration_seconds_count[5m]))
Logs: Structured JSON with Trace ID Correlation
Unstructured printf logs are unsearchable. Structured logs as JSON fields let you query and correlate by trace_id. Always add trace_id to every log so you can jump from metrics alert → trace → specific log lines.
package logging

import (
	"context"
	"fmt"
	"log/slog"
	"os"

	"go.opentelemetry.io/otel/trace"
)

func InitLogger() *slog.Logger {
	return slog.New(slog.NewJSONHandler(os.Stdout, nil))
}

// FromContext adds trace_id to logger for correlation
func FromContext(ctx context.Context, base *slog.Logger) *slog.Logger {
	span := trace.SpanFromContext(ctx)
	if !span.SpanContext().IsValid() {
		return base
	}
	return base.With(
		slog.String("trace_id", span.SpanContext().TraceID().String()),
	)
}

// Usage: every method starts with FromContext
func (s *OrderService) CreateOrder(ctx context.Context, req OrderRequest) (*Order, error) {
	log := FromContext(ctx, s.logger)

	log.Info("creating order",
		slog.String("user_id", req.UserID),
		slog.Float64("amount", req.Amount),
	)

	order, err := s.repo.Insert(ctx, req)
	if err != nil {
		log.Error("order insertion failed", slog.Any("error", err))
		return nil, fmt.Errorf("insert: %w", err)
	}
	return order, nil
}
Critical sampling rules: Never sample WARN or ERROR logs — you need 100% of failures for root cause investigation. INFO logs can be sampled based on endpoint:
ERROR: 100% (always)WARN: 100% (always)INFO(business operations): 50-100%INFO(/health, /metrics endpoints): 1-5%DEBUG: 0% in production
Traces: Show Which Service Is Slow
OpenTelemetry creates spans for each service call, letting you see exactly where a request gets slow. Start a span at handler boundaries and auto-propagate trace context to downstream services.
The span tree is the latency budget made visible — one bar per operation, the wide ones tell you where the time went:
gantt
    title Trace timeline — checkout request, p99 = 480ms
    dateFormat X
    axisFormat %L
    section Edge
    HTTP handler (checkout)        :active, 0, 480
    section Service
    AuthZ check                    :crit, 5, 35
    Inventory.Reserve              :40, 80
    Payment.Charge                 :120, 380
    Order.Persist                  :385, 420
    Notification.Enqueue           :425, 470
    section Detail
    Stripe API (in Payment)        :crit, 130, 360
    DB INSERT (in Order.Persist)   :390, 420
The crit-coloured bars are where the time goes: Stripe takes 230ms inside Payment.Charge; AuthZ adds a less obvious 30ms before any real work starts. Without spans, the trace looks like "checkout slow" — with spans, the third-party API jumps out as the obvious p99 driver.
package tracing

import (
	"context"
	"fmt"

	"go.opentelemetry.io/otel"
	"go.opentelemetry.io/otel/attribute"
	"go.opentelemetry.io/otel/codes"
	"go.opentelemetry.io/otel/exporters/otlp/otlptrace/otlptracehttp"
	"go.opentelemetry.io/otel/propagation"
	"go.opentelemetry.io/otel/sdk/resource"
	sdktrace "go.opentelemetry.io/otel/sdk/trace"
	semconv "go.opentelemetry.io/otel/semconv/v1.43.0"
	"go.opentelemetry.io/otel/trace"
)

func InitTracer(ctx context.Context, svc string) (func(context.Context) error, error) {
	exporter, err := otlptracehttp.New(ctx,
		otlptracehttp.WithEndpoint("otel-collector:4318"),
		otlptracehttp.WithInsecure(), // default is HTTPS; the Collector's 4318 receiver below is plaintext
	)
	if err != nil {
		return nil, fmt.Errorf("create otlp exporter: %w", err)
	}
	tp := sdktrace.NewTracerProvider(
		sdktrace.WithBatcher(exporter),
		sdktrace.WithResource(resource.NewWithAttributes(semconv.SchemaURL, semconv.ServiceName(svc))),
	)
	otel.SetTracerProvider(tp)
	// otelhttp reads the global propagator, which is a no-op until you set one.
	otel.SetTextMapPropagator(propagation.TraceContext{})
	return tp.Shutdown, nil
}

// CreateOrder shows correct span pattern: one span per logical operation
func (s *OrderService) CreateOrder(ctx context.Context, req OrderRequest) (*Order, error) {
	ctx, span := s.tracer.Start(ctx, "CreateOrder",
		trace.WithAttributes(attribute.String("user_id", req.UserID)),
	)
	defer span.End()

	// Database call: child span
	order, err := s.repo.Insert(ctx, req)
	if err != nil {
		span.RecordError(err)
		span.SetStatus(codes.Error, "insert failed")
		return nil, fmt.Errorf("insert: %w", err)
	}
	return order, nil
}
Trace propagation: Use OpenTelemetry HTTP middleware to auto-inject/extract trace context headers. This connects logs and traces across all services in the request path.
# Tail-based sampling: keep 100% of errors and slow requests, 1-5% of fast successes
processors:
  tail_sampling:
    decision_wait: 10s
    policies:
      - name: errors
        type: status_code
        status_code: { status_codes: [ERROR] }
      - name: slow_traces
        type: latency
        latency: { threshold_ms: 1000 }
      - name: baseline
        type: probabilistic
        probabilistic: { sampling_percentage: 2 }
The OpenTelemetry Collector's tail_sampling processor implements this directly[4]. As an order-of-magnitude example: at 10K req/s with full sampling and ~3KB/span, raw trace volume runs into terabytes per day; the policy above can reduce that to tens of GB/day while keeping every trace you'd actually investigate.
Production Checklist
When deploying observability for the first time, follow this order:
- Metrics: Add Prometheus histograms to HTTP handlers (method, endpoint, status labels). Test cardinality before shipping.
- Logs: Structure logs as JSON with
trace_idfield. Never sample ERROR/WARN. Sample INFO at 10-50% depending on endpoint volume. - Traces: Initialize OpenTelemetry with OTLP exporter. Wrap HTTP handlers with otelhttp middleware for auto-propagation.
- Sampling: Enable tail-based sampling on the OTel Collector to keep 100% of errors and slow (>1s) requests, 1-5% of fast successes.
- Alerting: Create 2-3 initial alerts on p99 latency and error rate. Every alert must link to a runbook. Route P1 alerts to PagerDuty, P2 to Slack.
- Correlation: Verify that error rate spike in metrics links to spans in traces, spans link back to logs via trace_id.
From metrics to traces to logs in 60 seconds — the unified runbook
The pillars only pay off if your on-call can pivot between them without reading documentation. The four artefacts below — a Grafana panel with exemplars, a Loki LogQL query keyed on trace_id, a Tempo lookup, and a wrapper shell script — are the paste-ready glue that turns three disconnected dashboards into a single triage flow.
A Grafana panel that renders both the latency histogram and the error-rate side-by-side, with "exemplar": true on the histogram query so Grafana plots the trace IDs attached to observations. Exemplars exist only if you record them: InstrumentedHandler above calls plain Observe, so switch it to ObserveWithExemplar(duration, prometheus.Labels{"trace_id": id}) via prometheus.ExemplarObserver, serve /metrics with promhttp.HandlerOpts{EnableOpenMetrics: true}, and start Prometheus with --enable-feature=exemplar-storage. Then, with the Prometheus data source's exemplar link pointed at Tempo, clicking an exemplar dot in the p99 line opens that trace:
{
  "title": "Checkout — p99 latency + error rate (with exemplars)",
  "type": "timeseries",
  "datasource": "Prometheus",
  "targets": [
    {
      "refId": "A",
      "expr": "histogram_quantile(0.99, sum by (le) (rate(http_request_duration_seconds_bucket{endpoint=\"/checkout\"}[5m])))",
      "legendFormat": "p99 latency",
      "exemplar": true
    },
    {
      "refId": "B",
      "expr": "sum(rate(http_request_duration_seconds_count{endpoint=\"/checkout\",status=~\"5..\"}[5m])) / sum(rate(http_request_duration_seconds_count{endpoint=\"/checkout\"}[5m]))",
      "legendFormat": "error rate"
    }
  ],
  "fieldConfig": {
    "defaults": {
      "custom": { "drawStyle": "line", "lineWidth": 2 },
      "links": [
        {
          "title": "Open trace in Tempo",
          "url": "/explore?left={\"datasource\":\"Tempo\",\"queries\":[{\"query\":\"${__value.raw}\"}]}"
        }
      ]
    }
  },
  "options": { "tooltip": { "mode": "multi" } }
}
Once an exemplar gives you a trace_id, the next pivot is logs. This LogQL query pulls every log line matching the trace_id and prefixes each with its service, so the on-call sees in one view which service emitted which error message:
{service=~"checkout|payment|inventory"}
  | json
  | trace_id = "4a7c9e2f1d8b3a6e5f0c1b2d3e4f5a6b"
  | line_format "{{.time}} [{{.service}}] {{.level}} {{.msg}} ({{.error}})"
Going the other direction — logs telling you "something is wrong" before metrics flag it — Tempo accepts the same trace_id and returns the full distributed span tree so you can see exactly which downstream call exploded:
{ trace:id = "4a7c9e2f1d8b3a6e5f0c1b2d3e4f5a6b" }
  | select(span:name, span:duration, span:status, resource.service.name)
  | by(resource.service.name)
Wrap all three pivots in a single shell script and your on-call's first reaction to a page is to paste the trace_id from the alert payload and have the answer in under a minute:
#!/usr/bin/env bash
# runbook.sh — metrics alert → trace → logs in under 60 seconds
# Usage: ./runbook.sh <trace_id>
set -euo pipefail

TRACE_ID="${1:?trace_id required (copy from PagerDuty exemplar link)}"
TEMPO_URL="${TEMPO_URL:-http://tempo:3200}"
LOKI_URL="${LOKI_URL:-http://loki:3100}"
WINDOW="${WINDOW:-15m}"

echo "==> 1. Span tree (which service is slow / failing?)"
curl -sf "${TEMPO_URL}/api/traces/${TRACE_ID}" \
  | jq -r '.batches[].scopeSpans[].spans[]
           | "\(.name)\t\(.status.code // "UNSET")\t\(((.endTimeUnixNano | tonumber) - (.startTimeUnixNano | tonumber)) / 1e6 | floor)ms"' \
  | column -t -s $'\t'

echo
echo "==> 2. Correlated logs (why exactly?)"
QUERY="{service=~\".+\"} | json | trace_id = \"${TRACE_ID}\""
curl -sf -G "${LOKI_URL}/loki/api/v1/query_range" \
  --data-urlencode "query=${QUERY}" \
  --data-urlencode "since=${WINDOW}" \
  | jq -r '.data.result[] | .stream.service as $svc | .values[]
           | (.[1] | fromjson? // {msg: .}) as $l
           | "\($l.time // "?") [\($svc // "?")] \($l.level // "?") \($l.msg // "?")"'

echo
echo "==> 3. Next steps: page service owner from span tree, paste trace link in incident channel"
If you cannot answer "what failed, where, and why" from a single trace_id in under a minute, your three pillars are not actually correlated — they are three separate dashboards with the same login.
Cardinality control: the silent killer of Prometheus reliability
The most common way to take Prometheus down is not query load — it is unbounded label cardinality[2]. A single rogue label with one value per request multiplies the active series count linearly with traffic, blows past the head chunk allocation, triggers the OOM killer mid-scrape, and leaves a gap in every dashboard that mattered. The defence is cheap and mechanical: normalise high-cardinality labels at the instrumentation boundary, and reject the rest at the registry.
Three patterns belong in every Go service that exposes Prometheus metrics. First, route templates not raw paths — /users/{id} rather than /users/123. Second, status classes not raw codes when the granularity is not actionable — 2xx for the SLO numerator, raw codes only on the error counter. Third, hash-bucketing for any label whose source you do not control, such as a user-supplied tenant header during a noisy onboarding storm.
The wrapper below collapses each of those rules into a single instrumentation helper. The router template and status class come from the framework; the tenant label is hashed to a fixed sixteen-bucket space, which keeps the active series count bounded even if a customer accidentally fans out one tenant ID per request. Because WithLabelValues panics when the value count does not match the declared labels, a refactor that adds a label without updating Observe fails the first unit test that calls it rather than the prod cluster:
package metrics

import (
	"hash/fnv"
	"strconv"

	"github.com/prometheus/client_golang/prometheus"
	"github.com/prometheus/client_golang/prometheus/promauto"
)

// tenantBuckets bounds the cardinality of any caller-supplied tenant label.
// 16 buckets is plenty for hot-spot detection and cannot OOM the TSDB.
const tenantBuckets = 16

func tenantBucket(tenant string) string {
	if tenant == "" {
		return "unknown"
	}
	h := fnv.New32a()
	_, _ = h.Write([]byte(tenant))
	return "b" + strconv.FormatUint(uint64(h.Sum32()%tenantBuckets), 10)
}

// statusClass collapses 2xx/3xx/4xx/5xx for SLO numerators.
// Keep the raw status code only on the error counter where granularity matters.
func statusClass(code int) string {
	switch {
	case code >= 500:
		return "5xx"
	case code >= 400:
		return "4xx"
	case code >= 300:
		return "3xx"
	default:
		return "2xx"
	}
}

// Replaces httpDuration from the first snippet: registering both panics at init
// (same metric name, different label names).
var requestDuration = promauto.NewHistogramVec(prometheus.HistogramOpts{
	Name:    "http_request_duration_seconds",
	Help:    "HTTP request latency by route template, method, status class, tenant bucket.",
	Buckets: []float64{0.005, 0.01, 0.025, 0.05, 0.1, 0.2, 0.5, 1, 2, 5},
}, []string{"route", "method", "status_class", "tenant_bucket"})

// Observe is the only public entry point. Callers cannot bypass normalisation.
func Observe(routeTemplate, method string, statusCode int, tenant string, durationSec float64) {
	requestDuration.WithLabelValues(
		routeTemplate,
		method,
		statusClass(statusCode),
		tenantBucket(tenant),
	).Observe(durationSec)
}
A unit test that pushes a synthetic traffic burst through Observe and asserts testutil.CollectAndCount(requestDuration) (from prometheus/testutil) stays under a threshold catches cardinality regressions before they ship. Pair the helper with an alerting rule that fires when prometheus_tsdb_head_series grows faster than the rolling baseline — by the time the dashboard turns red, the OOM is already in flight.
Tail-based sampling pipelines that survive a real outage
Head-based sampling — the SDK flips a coin per trace and either keeps everything or drops everything — discards exactly the traces you need during an incident. Tail sampling moves the decision to the OpenTelemetry Collector, which buffers spans for a short window (ten to thirty seconds), assembles each trace, and applies policy after it has seen the whole tree.
The two non-negotiable policies are: keep every trace that contains an error span, and keep every trace whose end-to-end duration (earliest span start to latest span end) exceeds the SLO threshold[4]. Everything else gets a low base rate (2% in the config below), which still gives statistically useful baselines[1] without paying for the long tail of healthy traffic.
The Collector configuration below needs no groupbytrace processor: tail_sampling groups spans by trace ID itself before any policy runs[4]. Sampled traces then go through batch for backend efficiency. To answer "which policy kept this trace?" weeks later, start the Collector with --feature-gates=processor.tailsamplingprocessor.recordpolicy, which adds a tailsampling.policy attribute to each sampled span:
receivers:
  otlp:
    protocols:
      grpc: { endpoint: 0.0.0.0:4317 }
      http: { endpoint: 0.0.0.0:4318 }

processors:
  tail_sampling:
    decision_wait: 20s
    num_traces: 200000
    expected_new_traces_per_sec: 5000
    policies:
      - name: keep-errors
        type: status_code
        status_code: { status_codes: [ERROR] }
      - name: keep-slow-traces
        type: latency
        latency: { threshold_ms: 1000 }
      - name: keep-priority-tenants
        type: string_attribute
        string_attribute:
          key: tenant.tier
          values: [enterprise, on-call-customer]
      - name: probabilistic-baseline
        type: probabilistic
        probabilistic: { sampling_percentage: 2 }

  batch:
    send_batch_size: 8192
    timeout: 5s

exporters:
  otlphttp/tempo:
    endpoint: https://tempo.internal:4318

service:
  pipelines:
    traces:
      receivers: [otlp]
      processors: [tail_sampling, batch]
      exporters: [otlphttp/tempo]
To run more than one tail-sampling replica, front them with a Collector tier using the loadbalancing exporter, whose default trace routing key is traceID, so every span from a given trace lands on the same replica[5]. A plain L4 load balancer cannot see trace IDs inside OTLP payloads, so the assembly window misses cross-replica spans and you get phantom partial traces. Pin decision_wait longer than your p99 trace duration (20s in the config above). Finally, emit otelcol_processor_tail_sampling_sampling_trace_dropped_too_early on a Grafana panel — when that counter starts growing, your buffer is undersized and you are losing the exact slow traces tail sampling was supposed to preserve.
Frequently Asked Questions
What is the difference between monitoring and observability?
Monitoring uses predefined checks to alert when something breaks. Observability lets you investigate why by correlating metrics, logs, and traces to understand failures you didn't anticipate.
How do metrics, logs, and traces work together during an incident?
Metrics alert you (error rate spike). Traces show where the failure occurs (which service). Logs give you the specific error details. This handoff enables fast root cause analysis.
What is OpenTelemetry and why use it?
OpenTelemetry is a vendor-neutral standard for collecting metrics, logs, and traces. Instrument once and export to a broad variety of backends (Datadog, Grafana, Jaeger), avoiding vendor lock-in.[6]
How should you sample traces in production?
Use tail-based sampling instead of fixed-rate head sampling. A tail-sampling policy can keep 100% of errors and slow requests and sample a small share (e.g. 1-5%) of successful ones — you get all the traces worth investigating at lower cost.[1]
Keep Reading
- SRE Guide to SLOs, SLIs, and Error Budgets — Multi-window burn rate alerting, error budget policies, and the organizational framework that turns metrics into reliability decisions
- Kubernetes Networking Deep Dive — CNI internals, kube-proxy, and CoreDNS debugging for the infrastructure your observability stack monitors
- Production Go API Design — Middleware-based instrumentation, OpenTelemetry tracing, and structured logging patterns for Go services
- Linux Commands Cheat Sheet — When dashboards lie, you SSH in: ss, lsof, strace, journalctl as the last-mile triage layer
- Building Resilient Distributed Systems with Go — Circuit breakers, bulkheads, and timeouts: the resilience policies your observability dashboard is measuring
- Postgres Query Planner Internals — When traces point to "the DB call is slow," EXPLAIN ANALYZE is the next pillar after distributed tracing
Sources
- 1.OpenTelemetry — Sampling (Concepts) — OpenTelemetry Project, 2026
- 2.Prometheus — Histograms, Summaries, and Labels Best Practices — Prometheus Project, 2026
- 3.Metric and label naming — Prometheus Documentation — Prometheus Project, 2026
- 4.Tail Sampling Processor (opentelemetry-collector-contrib README) — OpenTelemetry Project, 2026
- 5.Load-Balancing Exporter (opentelemetry-collector-contrib README) — OpenTelemetry Project, 2026
- 6.What is OpenTelemetry? — OpenTelemetry Project, 2026
Engineering Team
An independent engineering publication covering distributed systems, databases, and production infrastructure. Every factual claim is cited to a primary source or removed.
Read Next
SRE Guide to SLOs, SLIs, and Error Budgets: A Production Playbook
SLOs and error budgets: transforming reliability into organizational policy with Prometheus instrumentation and burn-rate alerts.

Terraform in Production: Modules, State Management, and CI/CD Patterns
Terraform in production: state locking, module design, environment directories, and CI/CD guardrails that prevent resource destruction.

Essential Kubernetes Commands: The Complete kubectl Cheat Sheet
Definitive kubectl reference: pod debugging, deployments, StatefulSets, RBAC, scheduling, Helm, and production troubleshooting flowcharts.